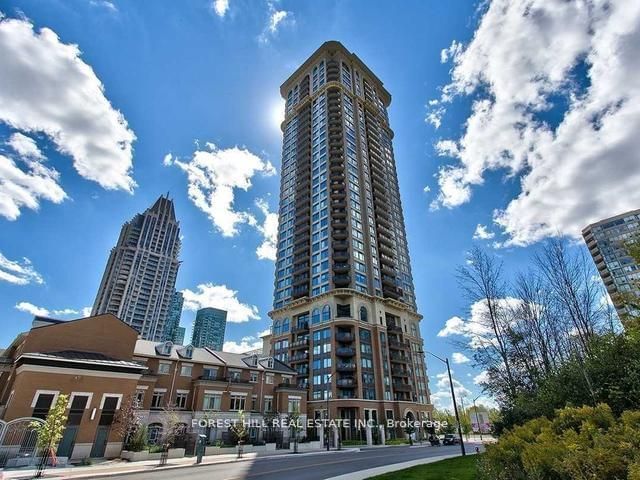
701 - 385 Prince of Wales Dr
Listing History
Unit Highlights
Maintenance Fees
Utility Type
- Air Conditioning
- Central Air
- Heat Source
- Gas
- Heating
- Forced Air
Room Dimensions
About this Listing
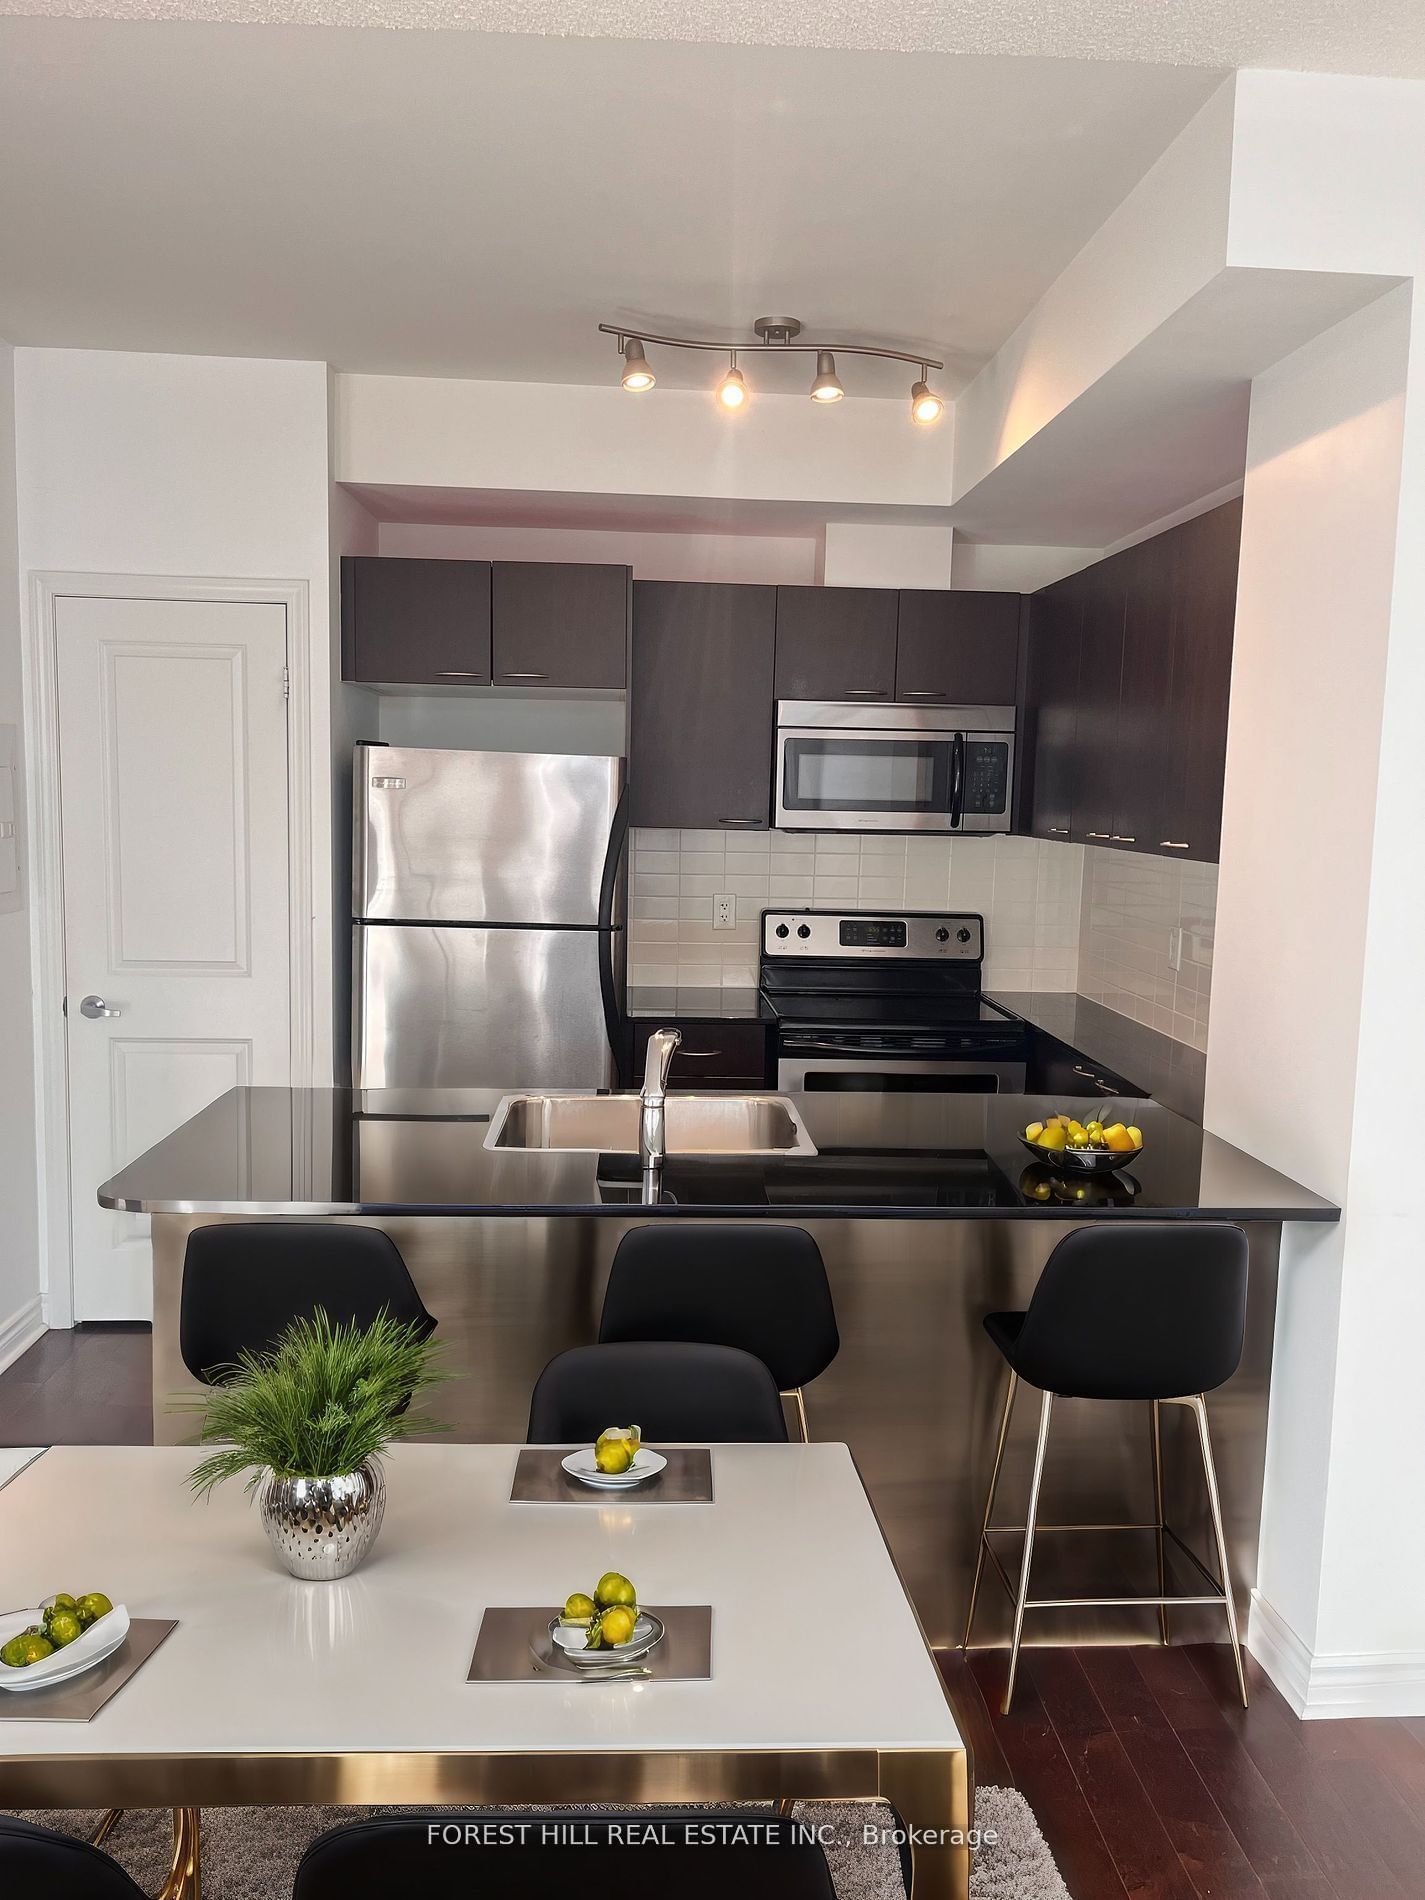
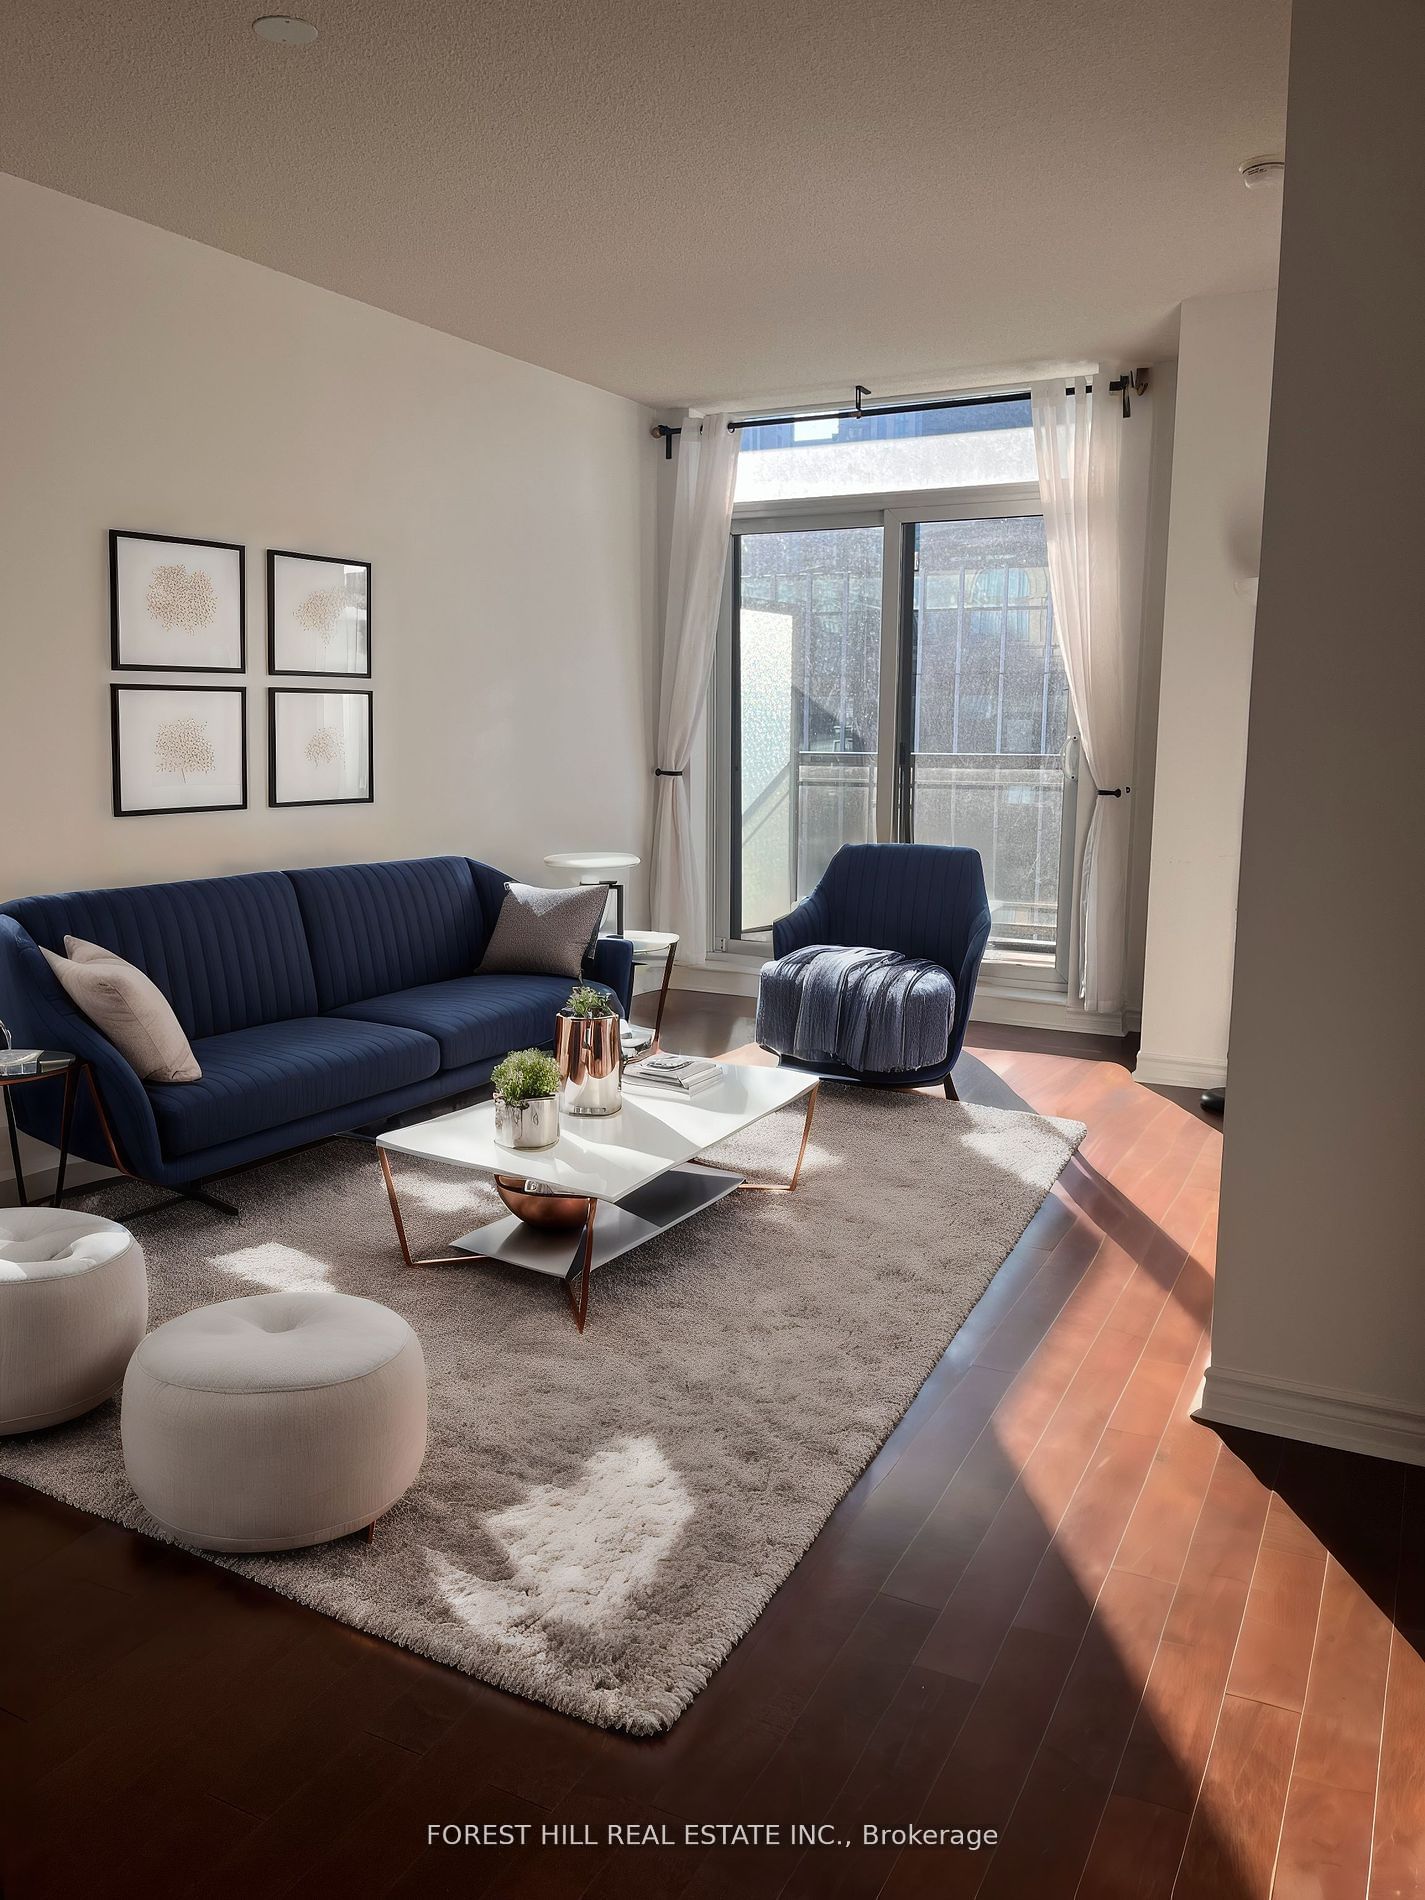
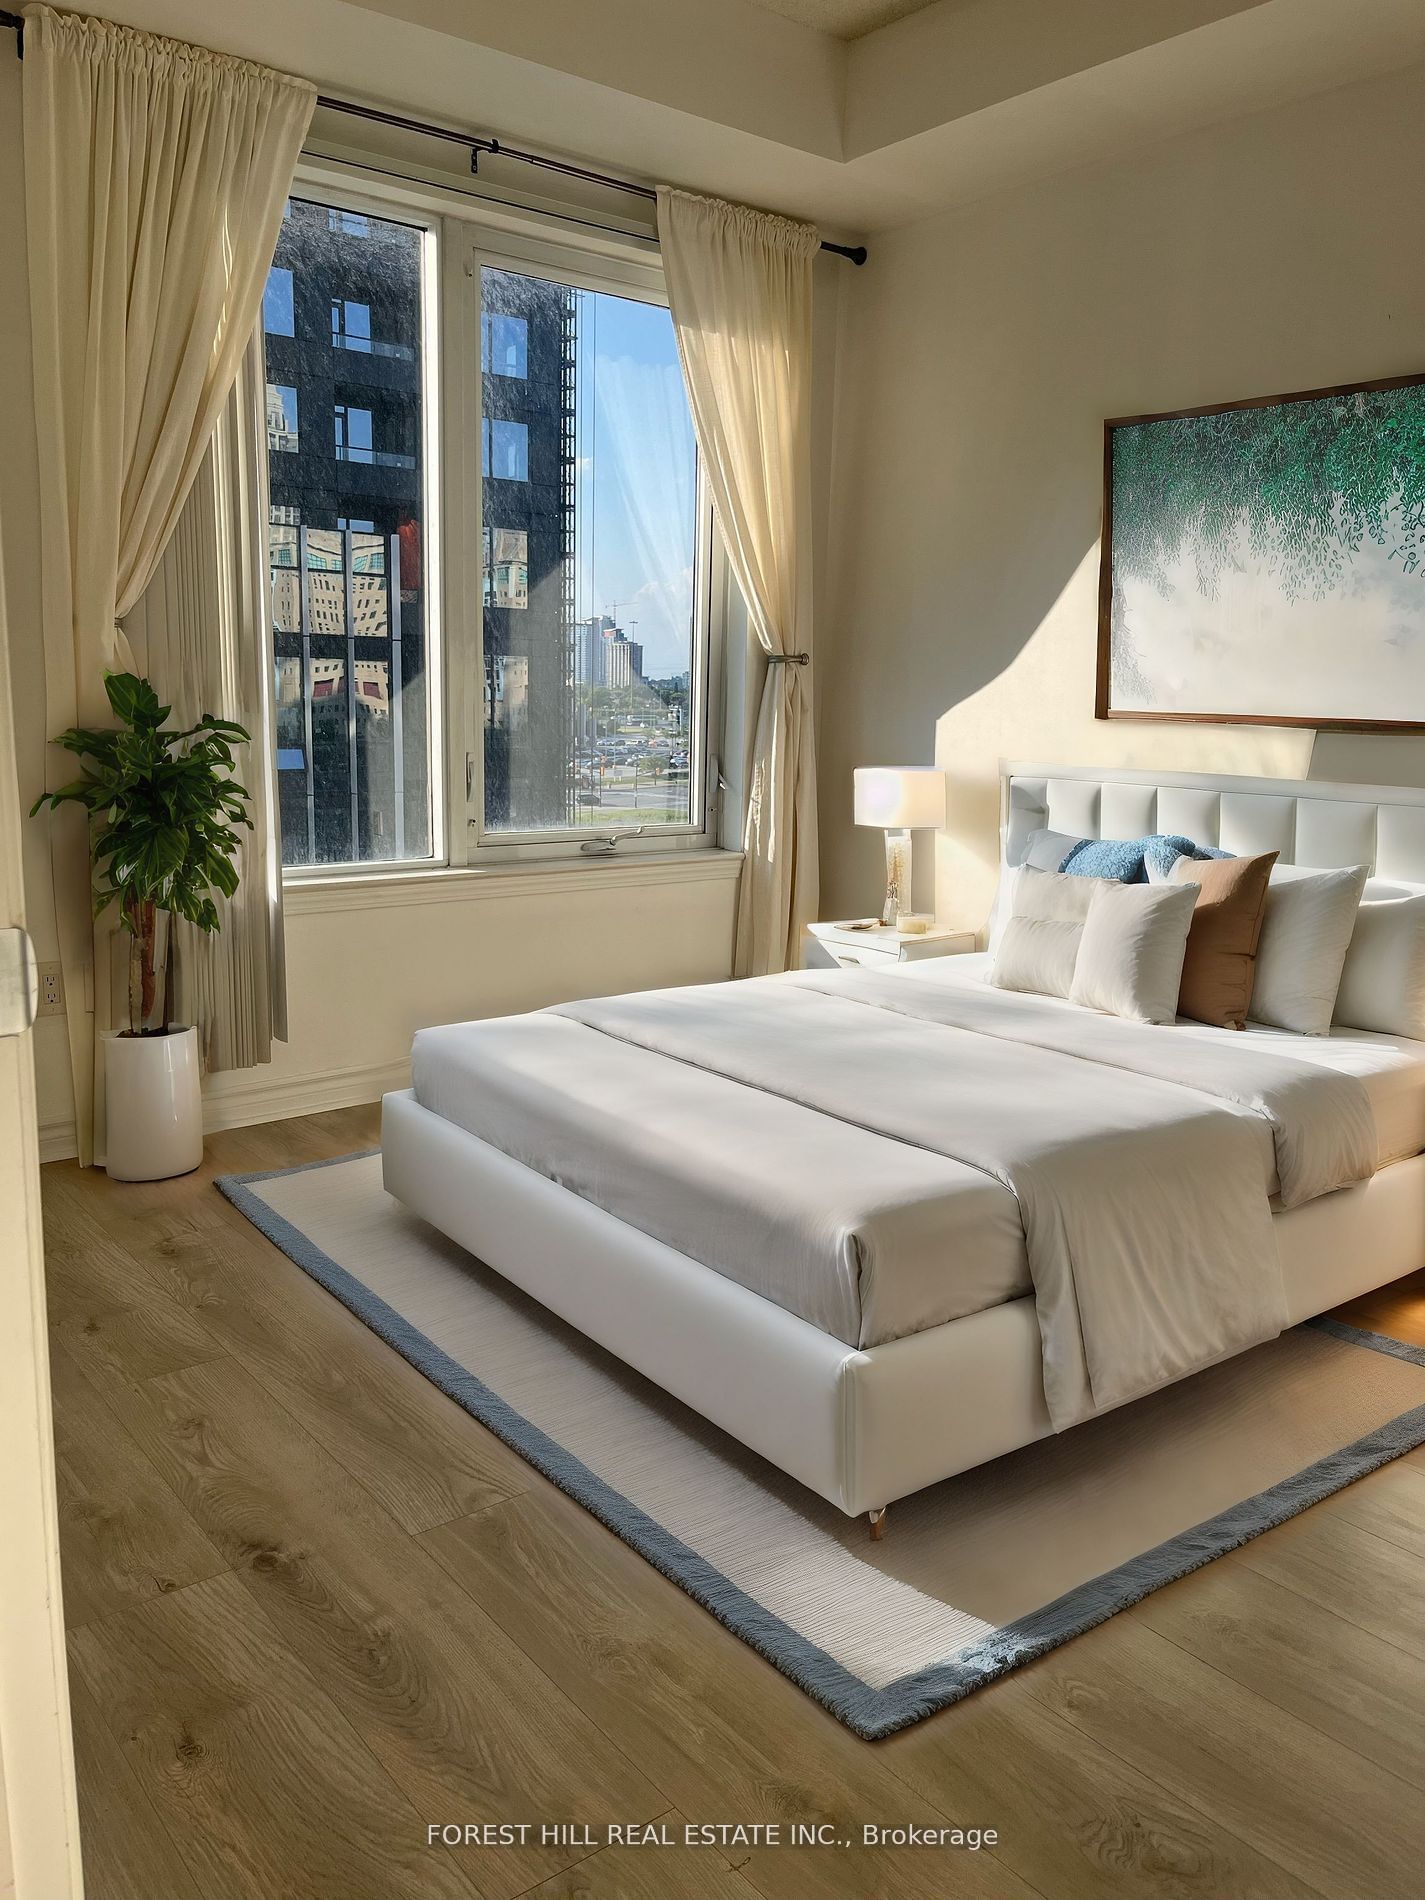
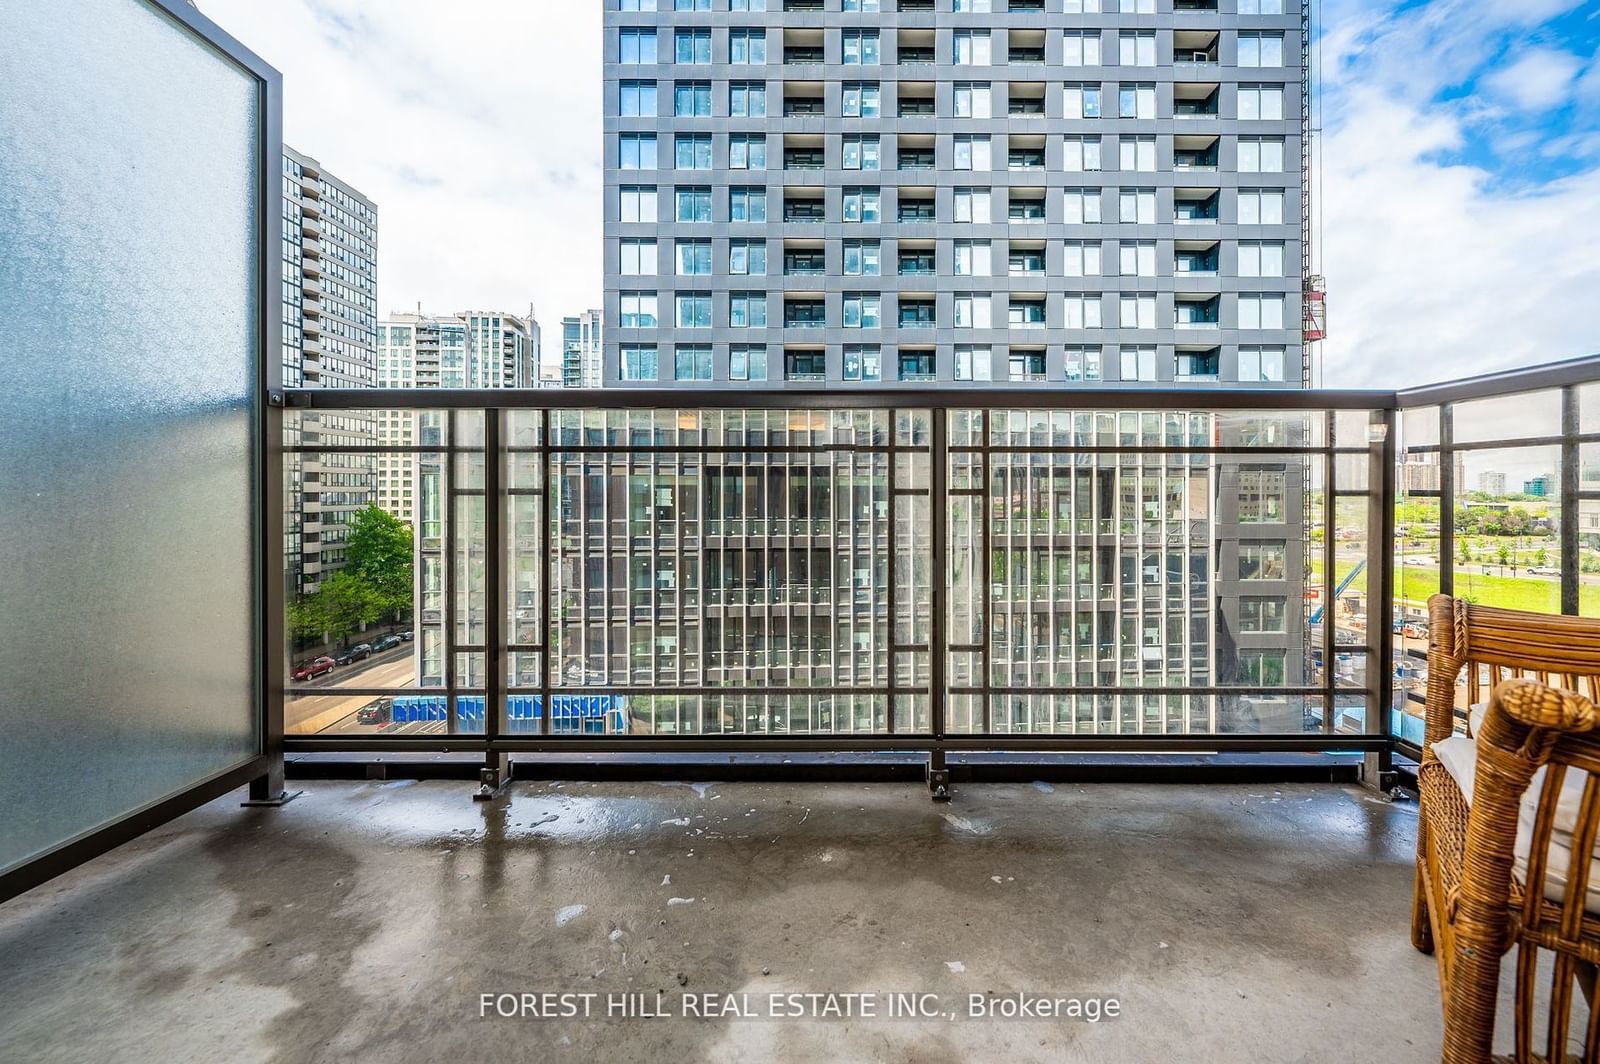
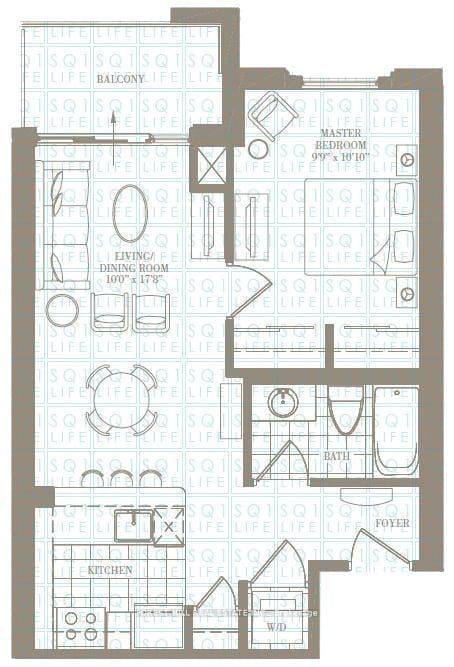
**Investment Property with existing income, offering a 3.78% Cap Rate** AAA Tenant with rental income of $2,400/month & an assumable lease expiring August 14th, 2025! High demand building for rentals! Amazing opportunity for buyers requiring additional income to qualify for a mortgage! Spacious unit with a functional layout! Open Concept Kitchen With Stainless Steel Appliances, Granite Counter Tops & A Large Breakfast Bar! The Primary Bedroom offers His and Her closets, a large window and updated laminate floors. Tall 9' Ceilings & Modern Baseboards throughout. North facing balcony that offers a tranquil setting & a sunny northern exposure! Quiet unit, yet located right in the heart of Mississauga's City Centre, Close Proximity To Public Transit such as the Go and Soon to be LRT! Easy access to Hwy 403 & Square One Shopping Centre! Indulge in the Many Restaurants, Cafes, Cinema, YMCA, Living Arts Centre, Public Library and the Performing Arts Venue!
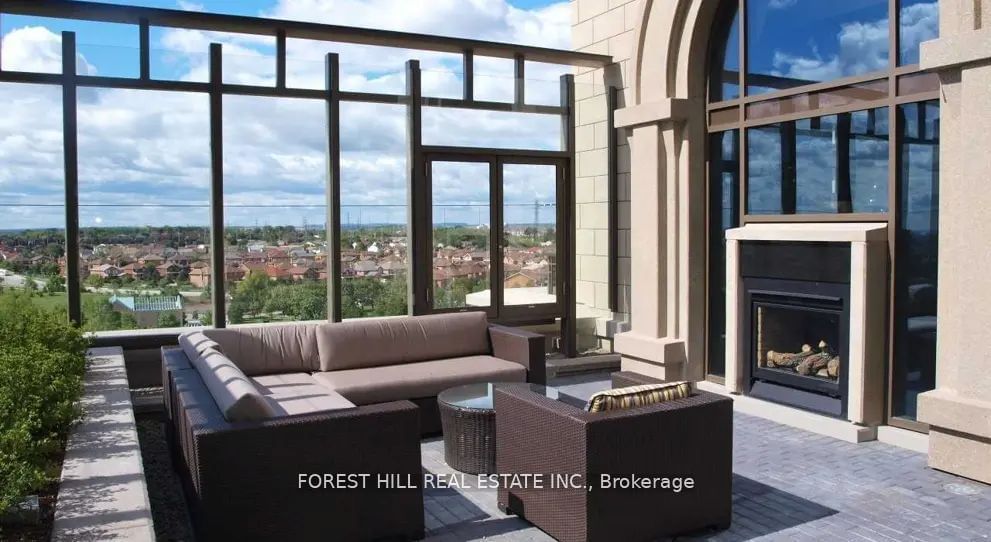
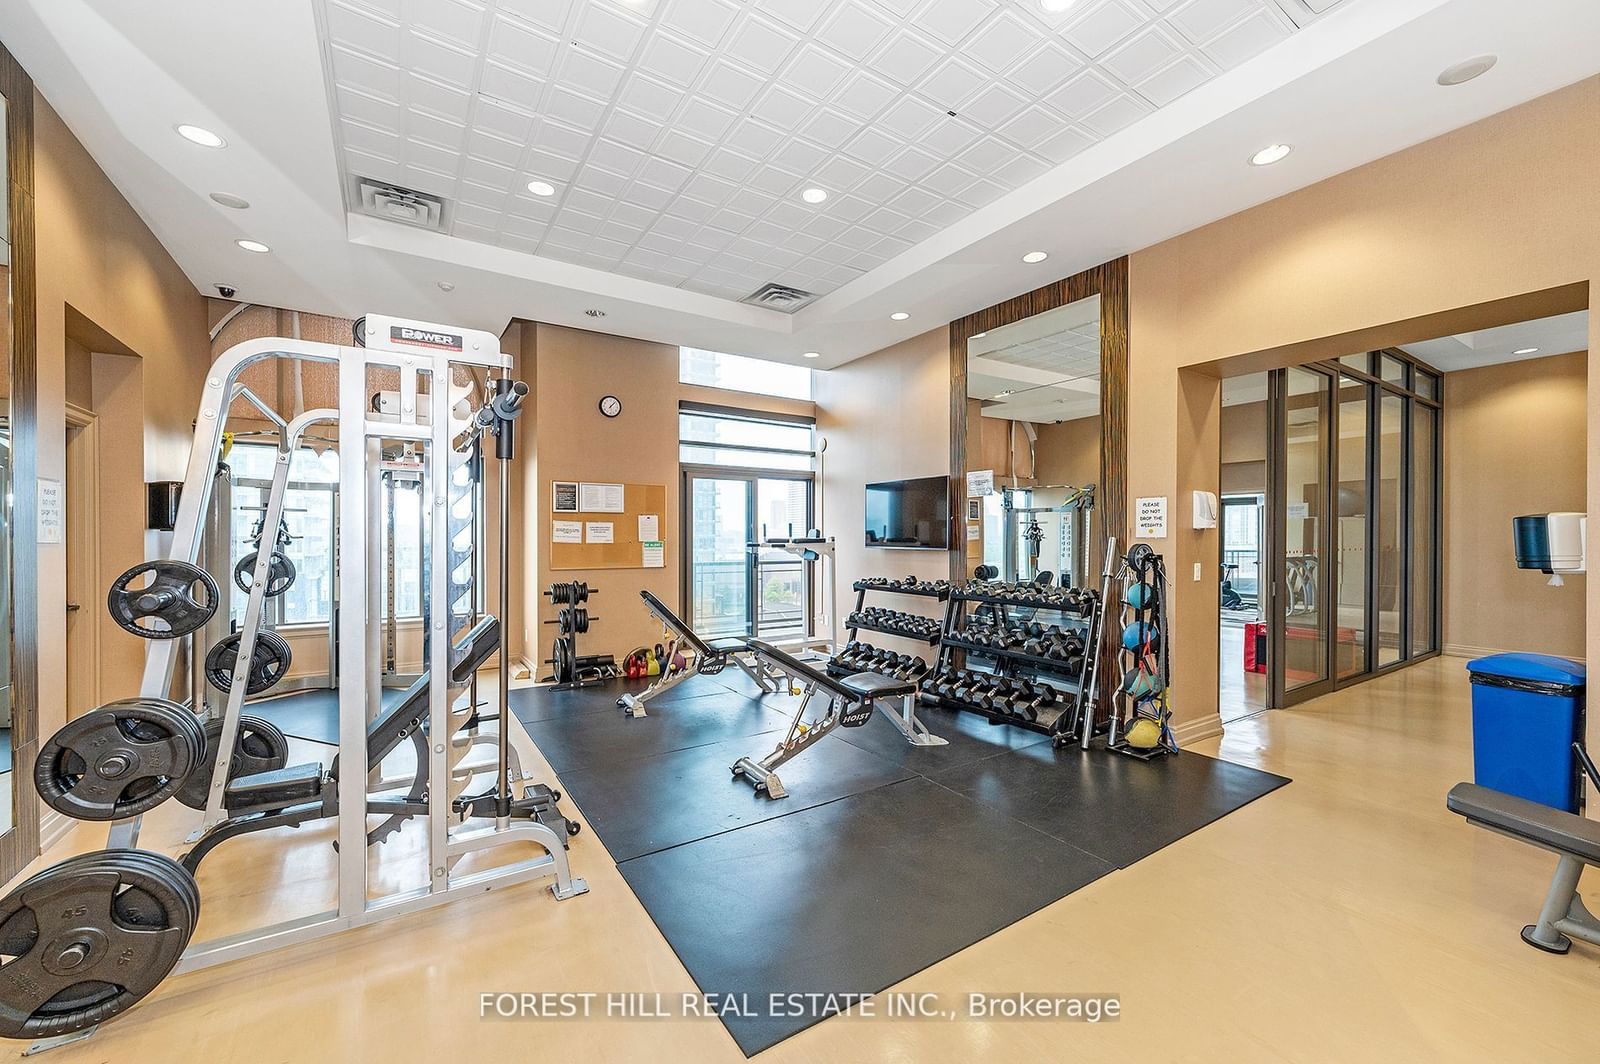
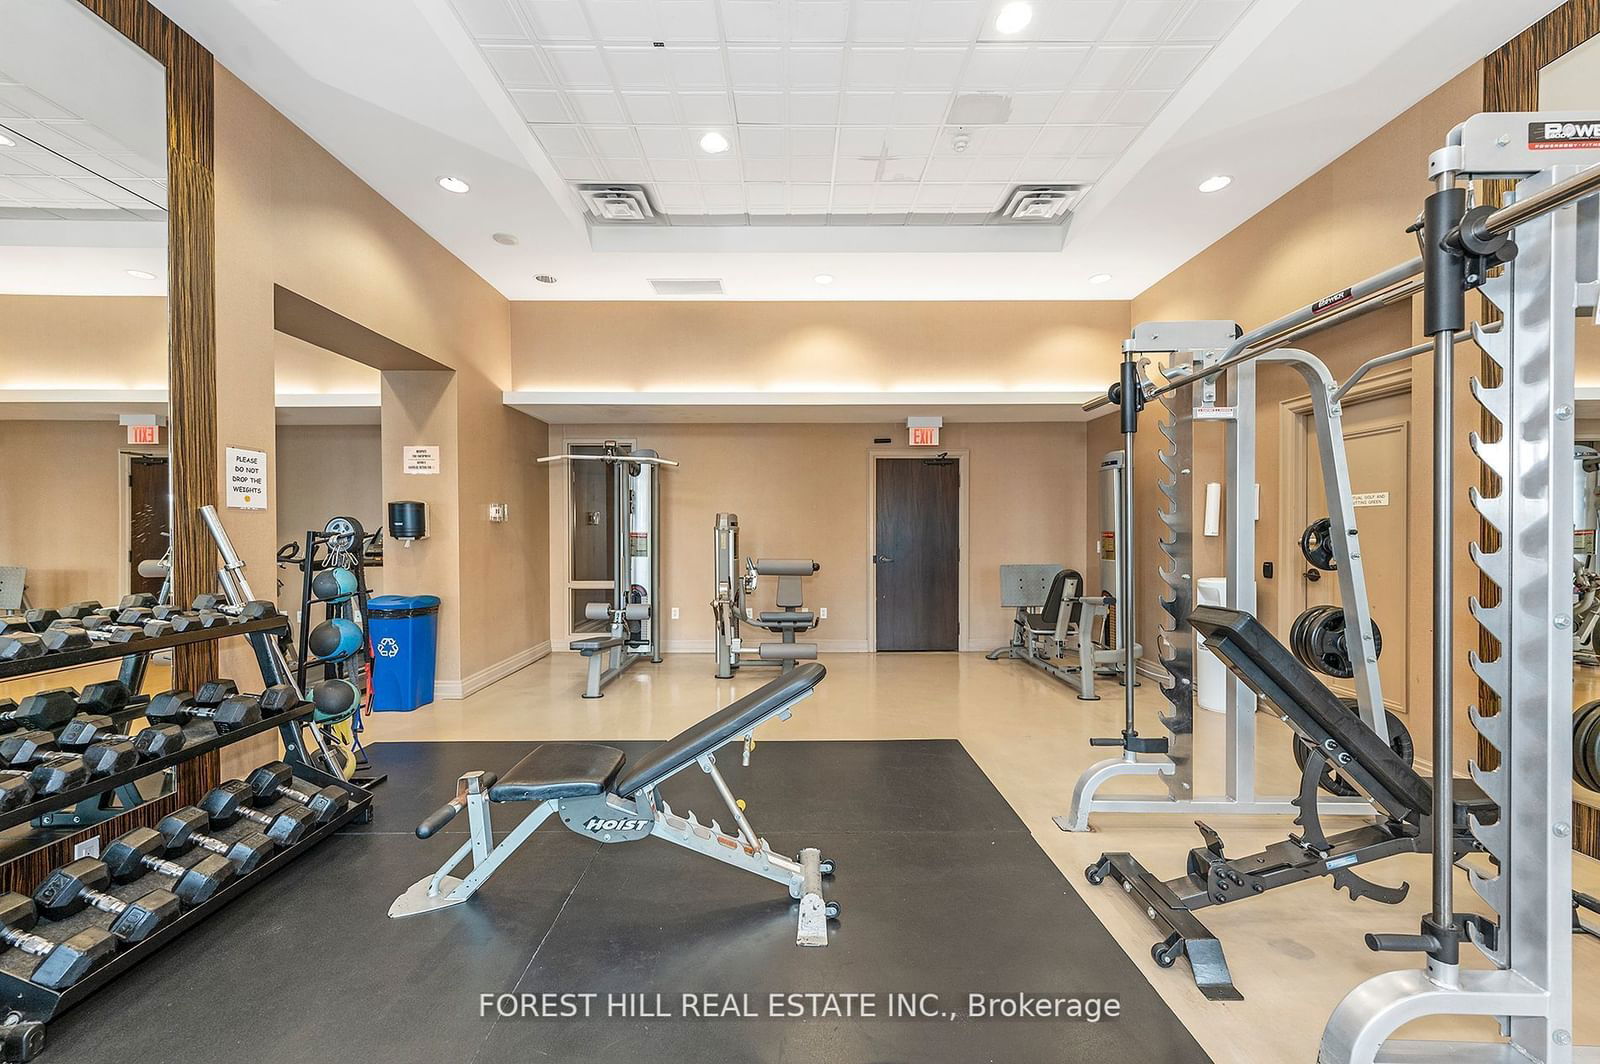
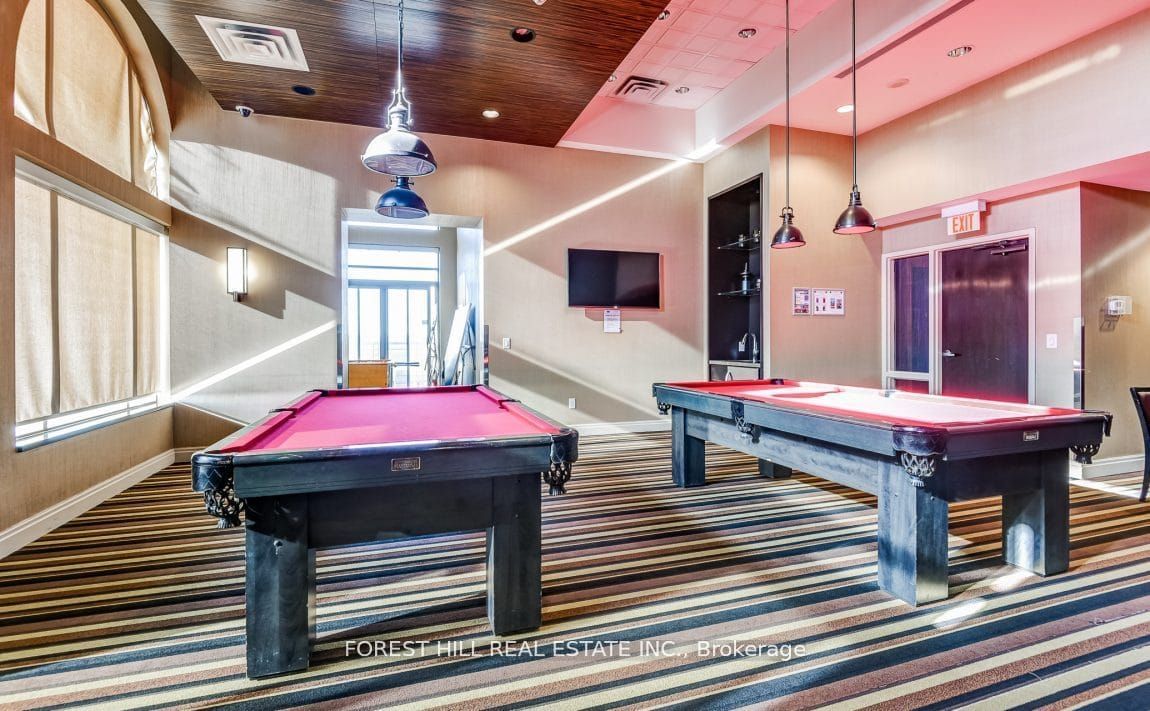
ExtrasAmenities Incl: An Indoor Pool, Saunas, Whirlpool, Gym, 24hr Concierge, Outdoor Deck, Party Rm, Billiards Rm, Theatre, Virtual Golf, Foosball Table and a Rock-Climbing Wall!
forest hill real estate inc.MLS® #W9366840
Amenities
Explore Neighbourhood
Similar Listings
Demographics
Based on the dissemination area as defined by Statistics Canada. A dissemination area contains, on average, approximately 200 – 400 households.
Price Trends
Maintenance Fees
Building Trends At Chicago Condos
Days on Strata
List vs Selling Price
Offer Competition
Turnover of Units
Property Value
Price Ranking
Sold Units
Rented Units
Best Value Rank
Appreciation Rank
Rental Yield
High Demand
Transaction Insights at 385 Prince of Wales Drive
| Studio | 1 Bed | 1 Bed + Den | 2 Bed | 2 Bed + Den | 3 Bed | 3 Bed + Den | |
|---|---|---|---|---|---|---|---|
| Price Range | $425,000 - $430,000 | $524,000 - $545,000 | $495,000 - $605,000 | $611,000 - $623,800 | $840,000 | No Data | No Data |
| Avg. Cost Per Sqft | $1,035 | $866 | $807 | $817 | $818 | No Data | No Data |
| Price Range | $1,900 - $2,200 | $2,200 - $2,500 | $2,300 - $2,750 | $2,750 - $3,200 | $2,900 - $3,500 | No Data | $3,600 |
| Avg. Wait for Unit Availability | 164 Days | 25 Days | 23 Days | 73 Days | 131 Days | 483 Days | 588 Days |
| Avg. Wait for Unit Availability | 56 Days | 12 Days | 11 Days | 47 Days | 125 Days | 369 Days | 113 Days |
| Ratio of Units in Building | 6% | 33% | 39% | 11% | 6% | 3% | 5% |
Transactions vs Inventory
Total number of units listed and sold in Downtown Core
