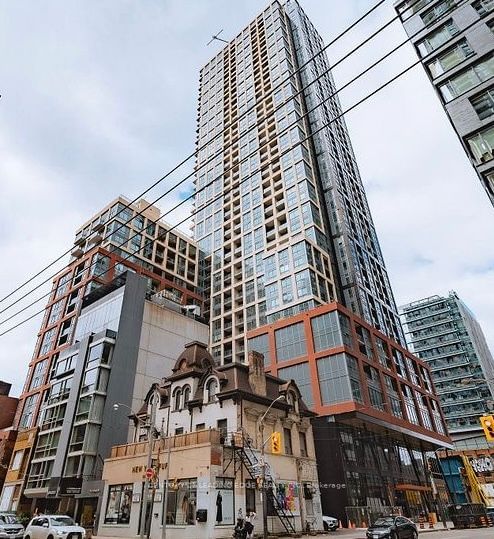
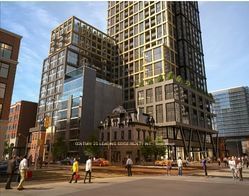
716 - 108 PETER St
Listing History
Unit Highlights
Utilities Included
Utility Type
- Air Conditioning
- Central Air
- Heat Source
- No Data
- Heating
- Forced Air
Room Dimensions
About this Listing
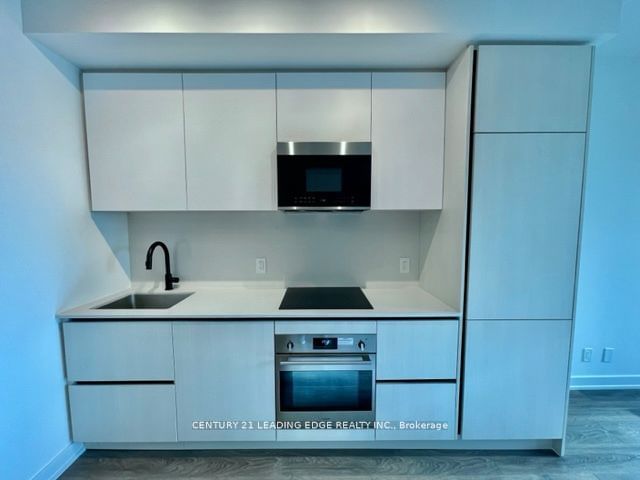
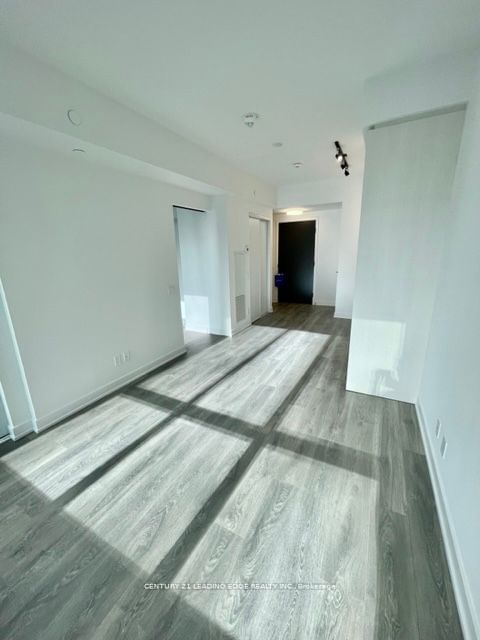
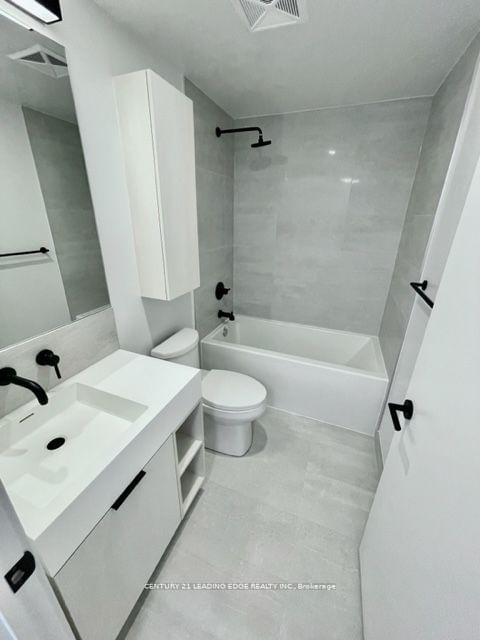
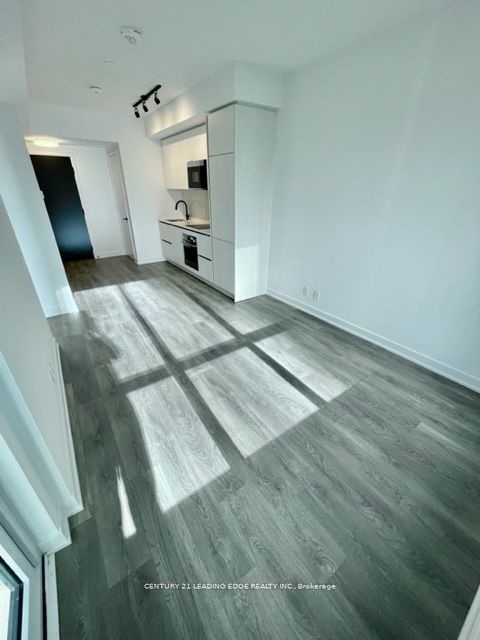
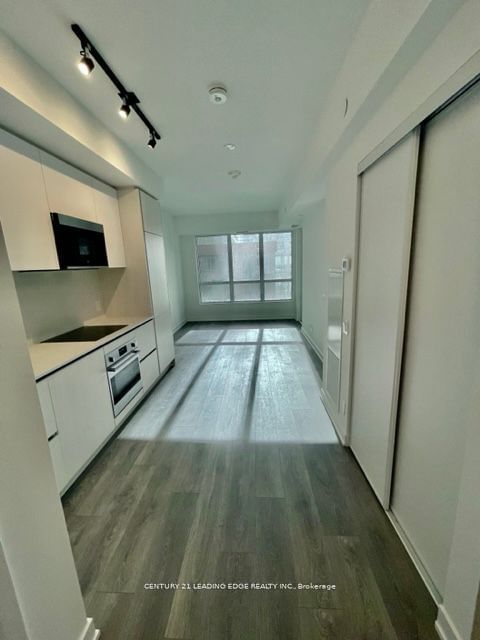
Welcome to this one-year new one-bedroom, one-bath condo at Peter St and Adelaide St W in the heart of Torontos vibrant Entertainment District. This open-concept space overlooks a lush garden and includes a 50 sq. ft. balcony, adding extra living space. Just steps from top restaurants, bars, shops, clubs, theatres, TTC subway access, Rogers Centre, CN Tower, and more. Enjoy 24/7 concierge service and an array of amenities, including a rooftop pool with cabanas, a lounge deck, a communal hi-tech workspace, a fully equipped gym, and a yoga studio.
ExtrasB/I Fridge, B/I Oven, Microwave & Hood, B/I dishwasher, Washer and Dryer, All ELFs.
century 21 leading edge realty inc.MLS® #C10296004
Amenities
Explore Neighbourhood
Similar Listings
Demographics
Based on the dissemination area as defined by Statistics Canada. A dissemination area contains, on average, approximately 200 – 400 households.
Price Trends
Maintenance Fees
Building Trends At Peter & Adelaide Condos
Days on Strata
List vs Selling Price
Offer Competition
Turnover of Units
Property Value
Price Ranking
Sold Units
Rented Units
Best Value Rank
Appreciation Rank
Rental Yield
High Demand
Transaction Insights at 350 Adelaide Street W
| Studio | 1 Bed | 1 Bed + Den | 2 Bed | 2 Bed + Den | 3 Bed | 3 Bed + Den | |
|---|---|---|---|---|---|---|---|
| Price Range | No Data | $508,000 - $635,000 | $590,000 - $770,000 | $720,000 - $1,070,000 | $893,000 | $875,000 - $1,340,000 | No Data |
| Avg. Cost Per Sqft | No Data | $1,253 | $1,190 | $1,168 | $1,298 | $1,192 | No Data |
| Price Range | $2,150 | $1,500 - $2,700 | $2,250 - $3,200 | $1,380 - $3,500 | $2,950 - $3,700 | $1,350 - $5,450 | No Data |
| Avg. Wait for Unit Availability | No Data | 55 Days | 33 Days | 45 Days | No Data | 87 Days | No Data |
| Avg. Wait for Unit Availability | 22 Days | 5 Days | 3 Days | 3 Days | 11 Days | 10 Days | No Data |
| Ratio of Units in Building | 1% | 20% | 33% | 31% | 7% | 10% | 1% |
Transactions vs Inventory
Total number of units listed and leased in Queen West
