429 - 2300 St Clair Ave W
Listing History
Unit Highlights
Maintenance Fees
Utility Type
- Air Conditioning
- Central Air
- Heat Source
- Gas
- Heating
- Forced Air
Room Dimensions
About this Listing
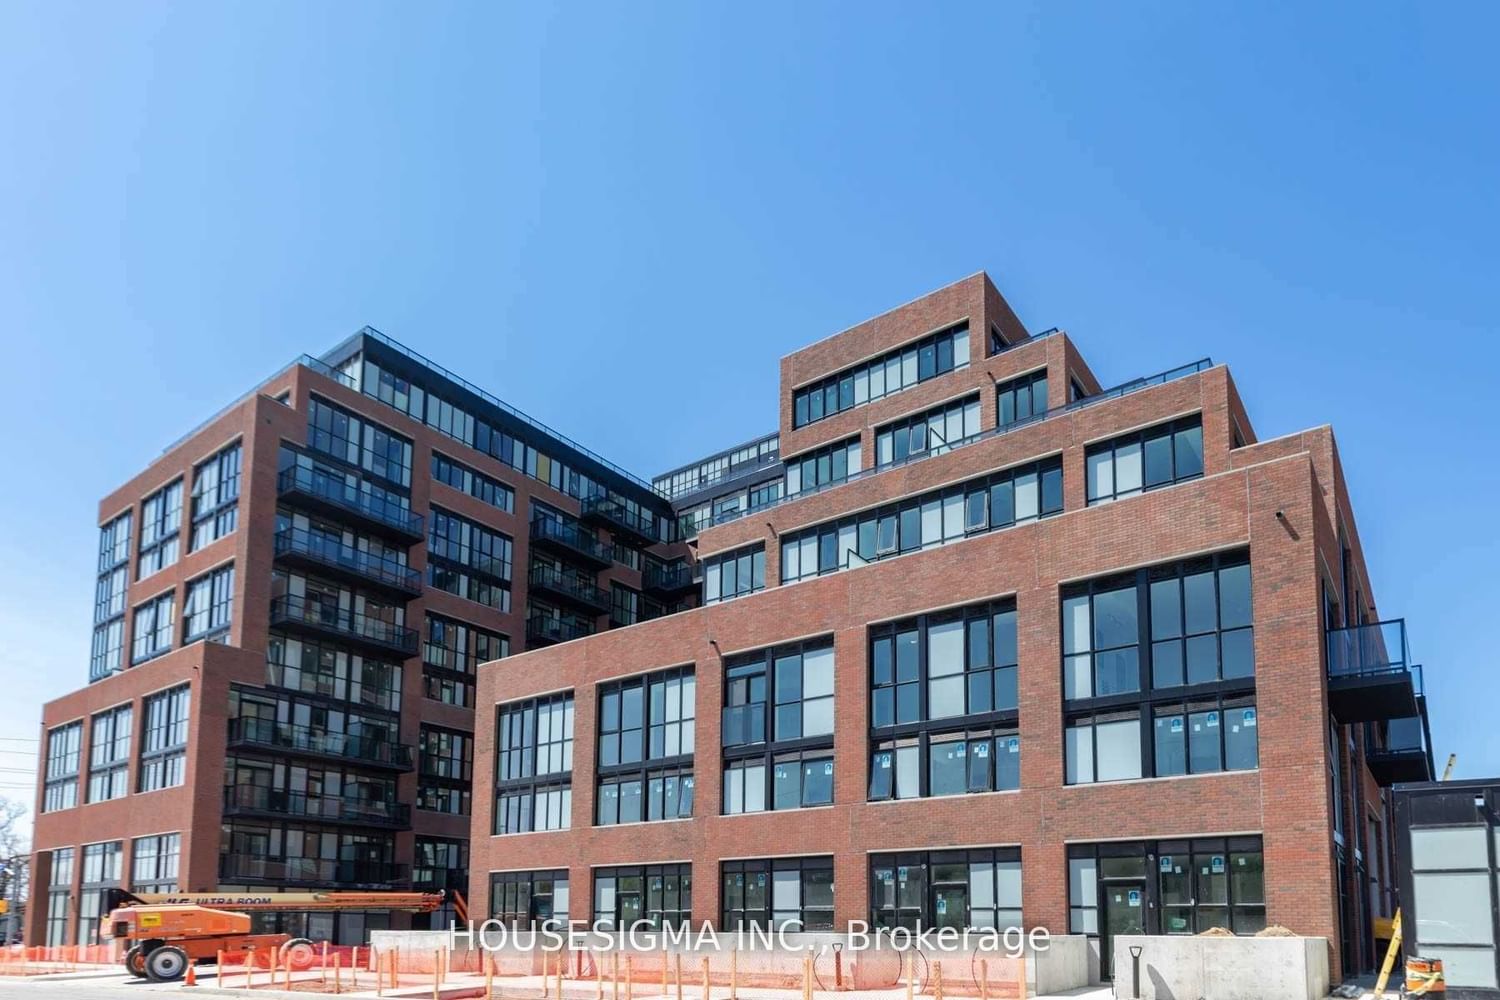
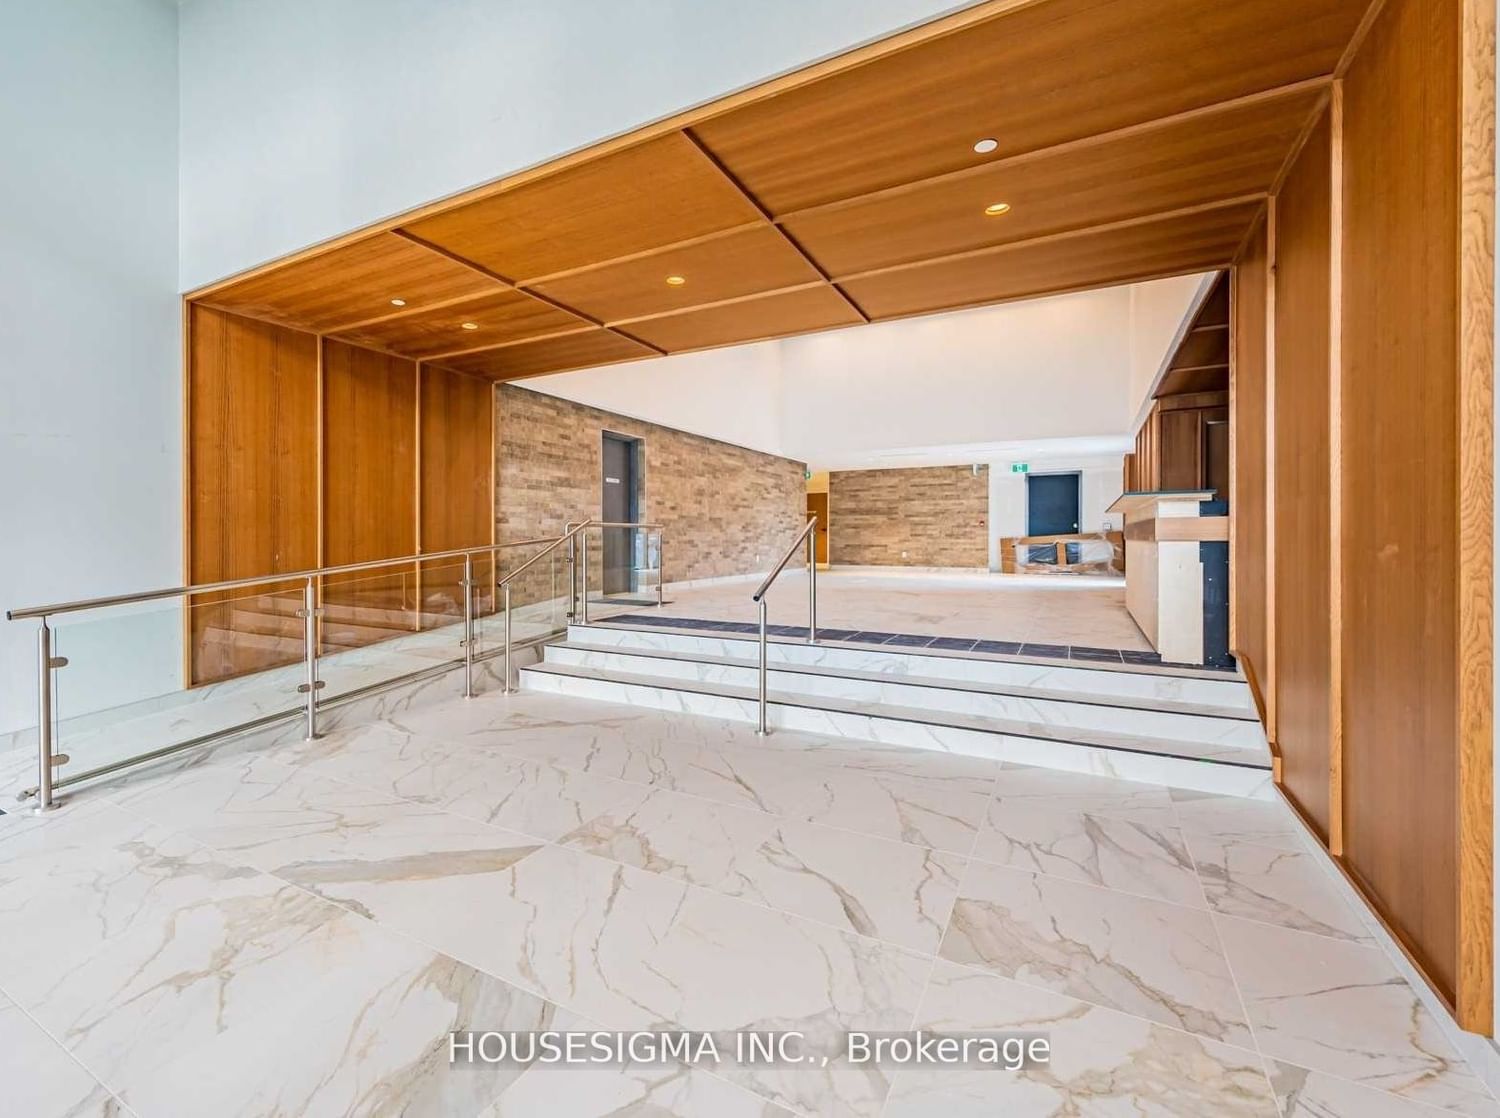
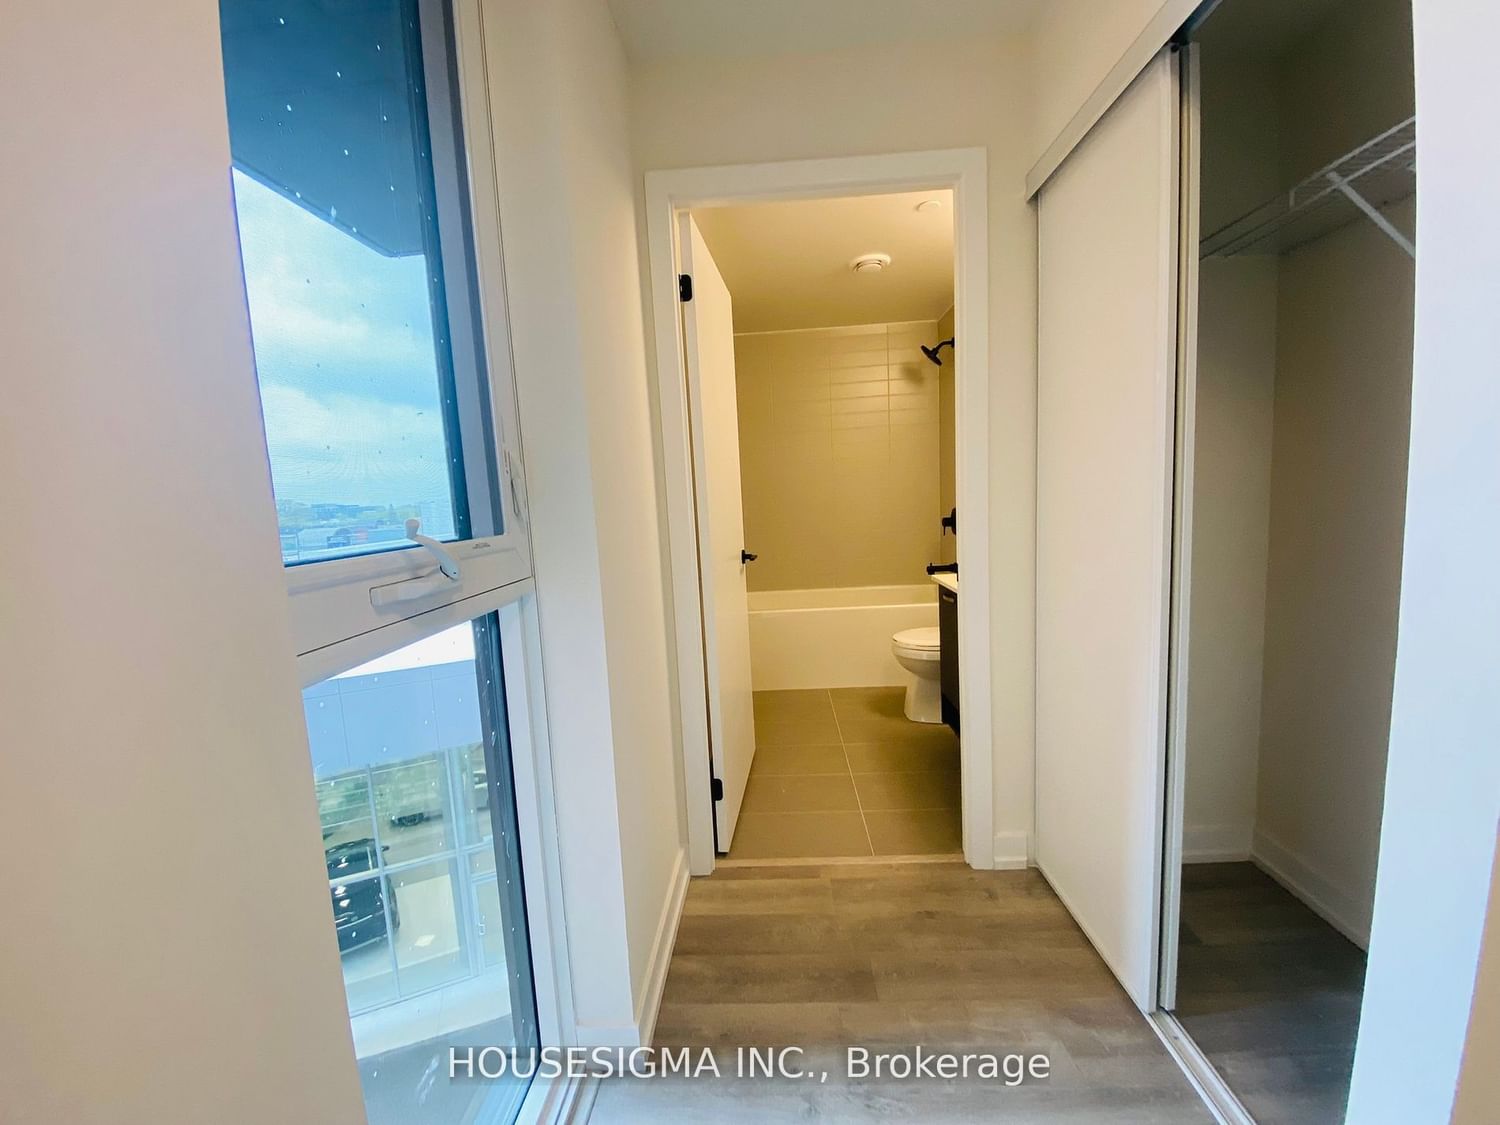
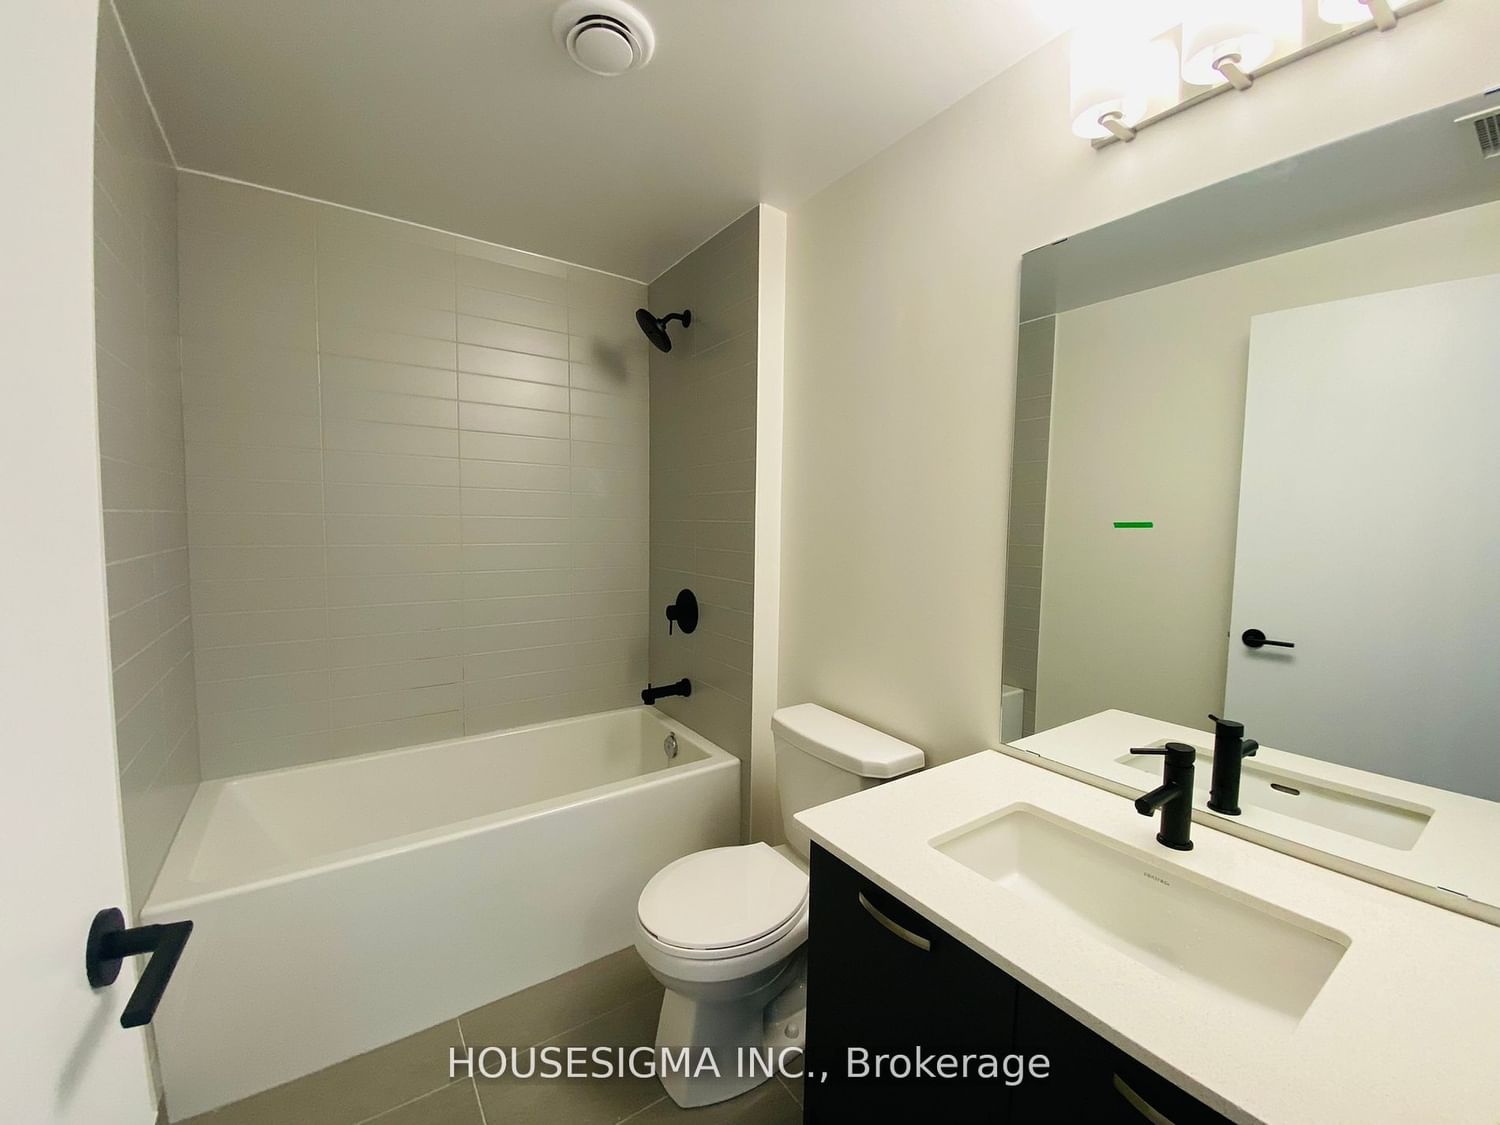
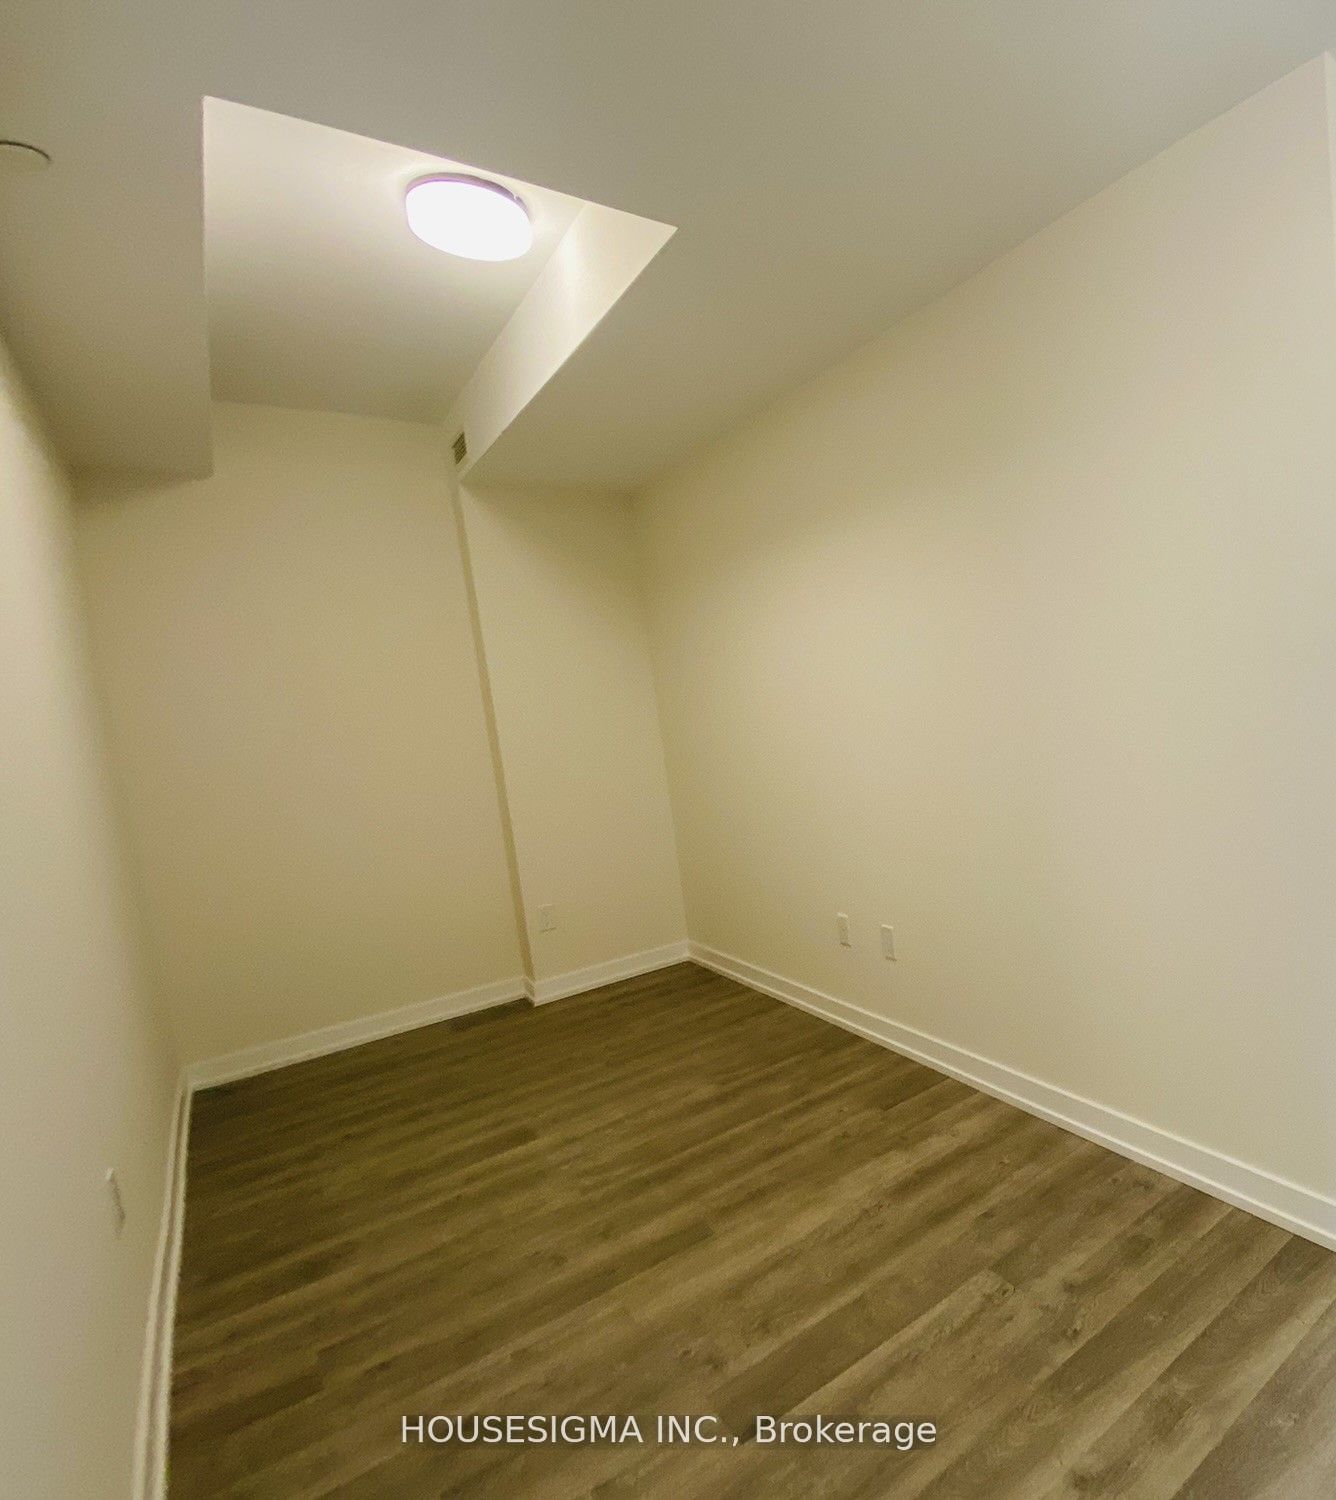
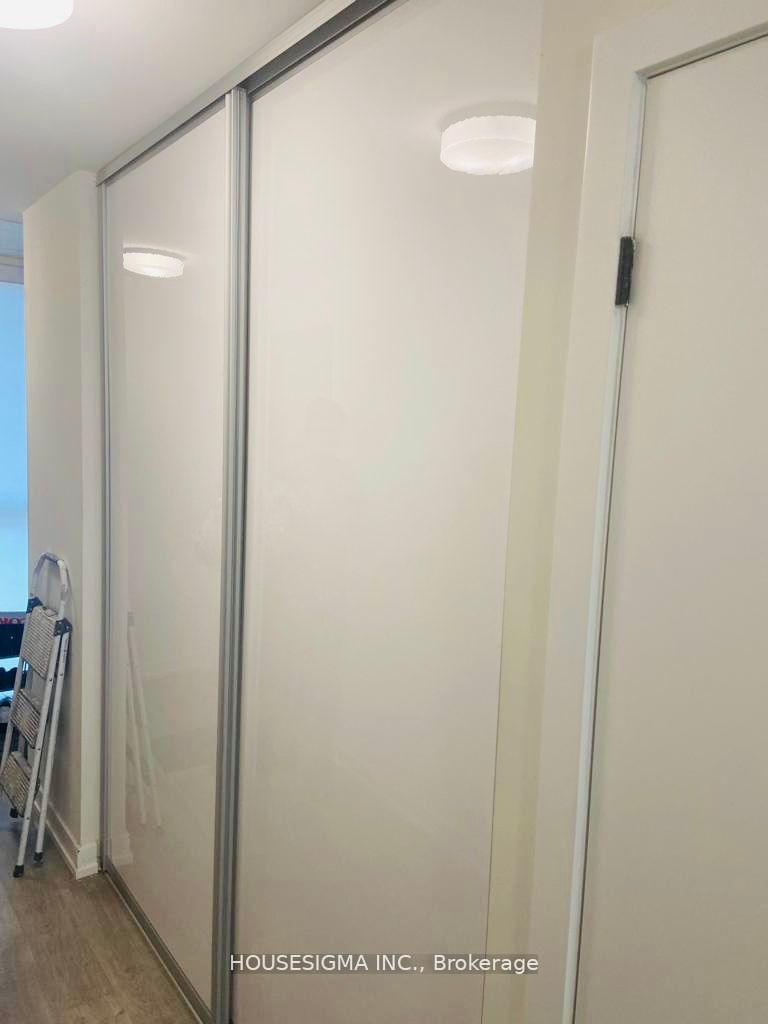
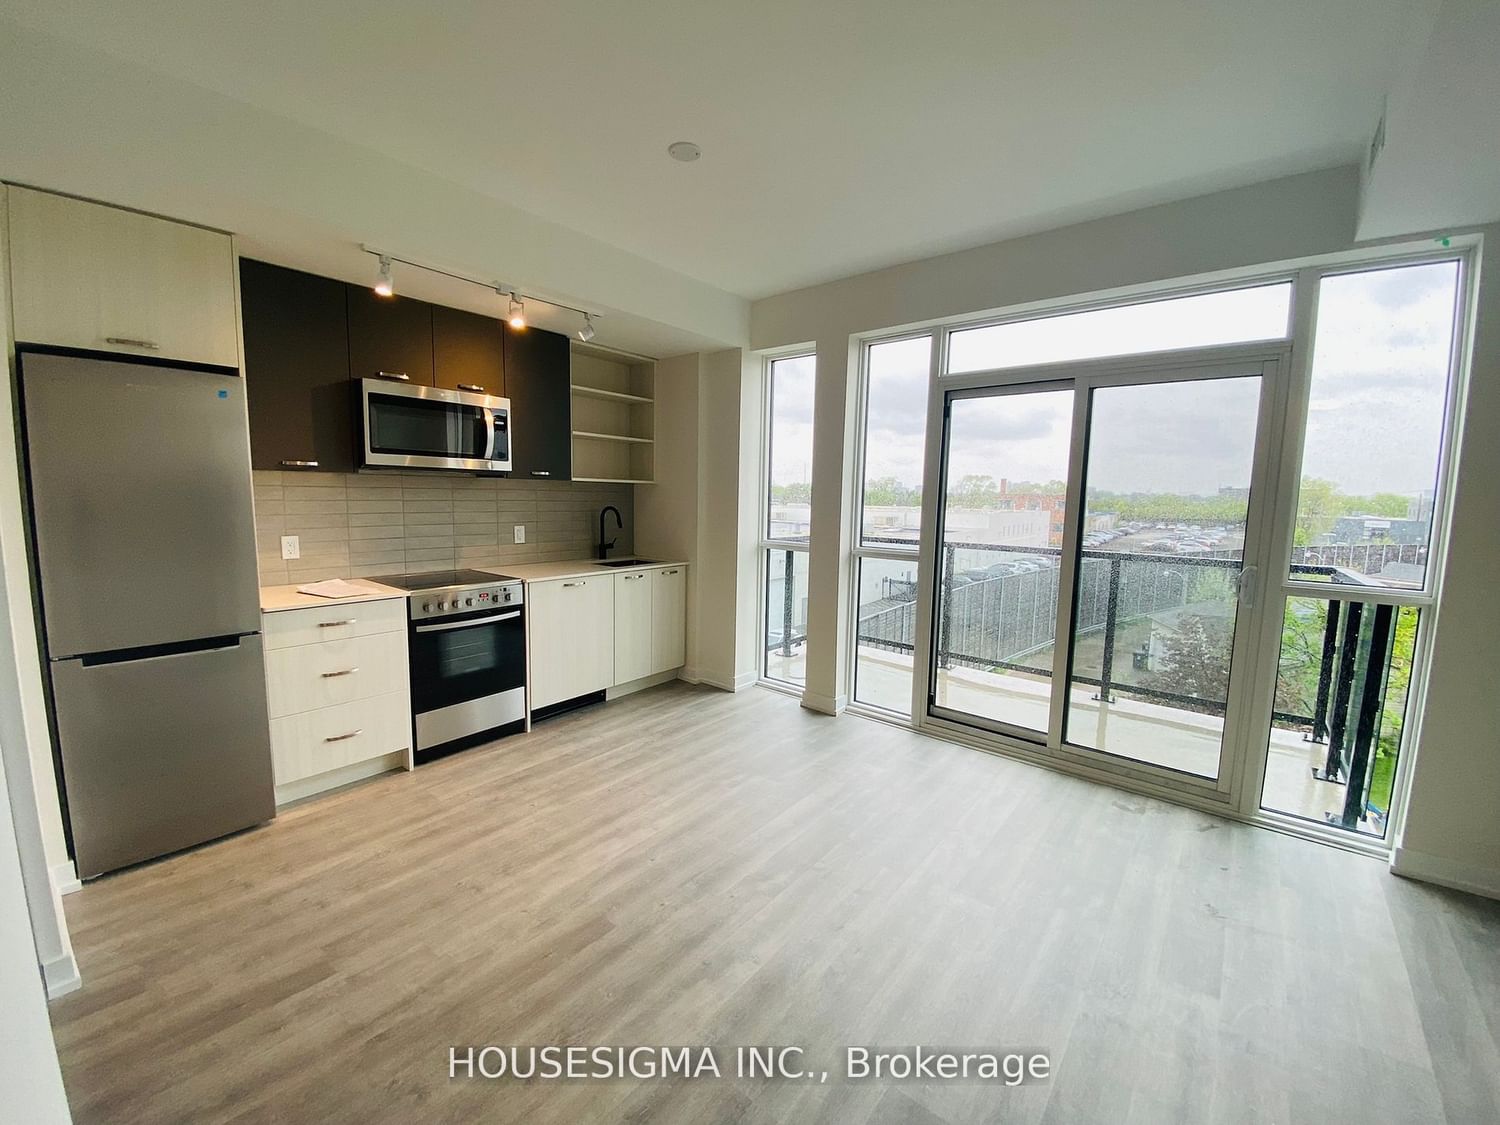
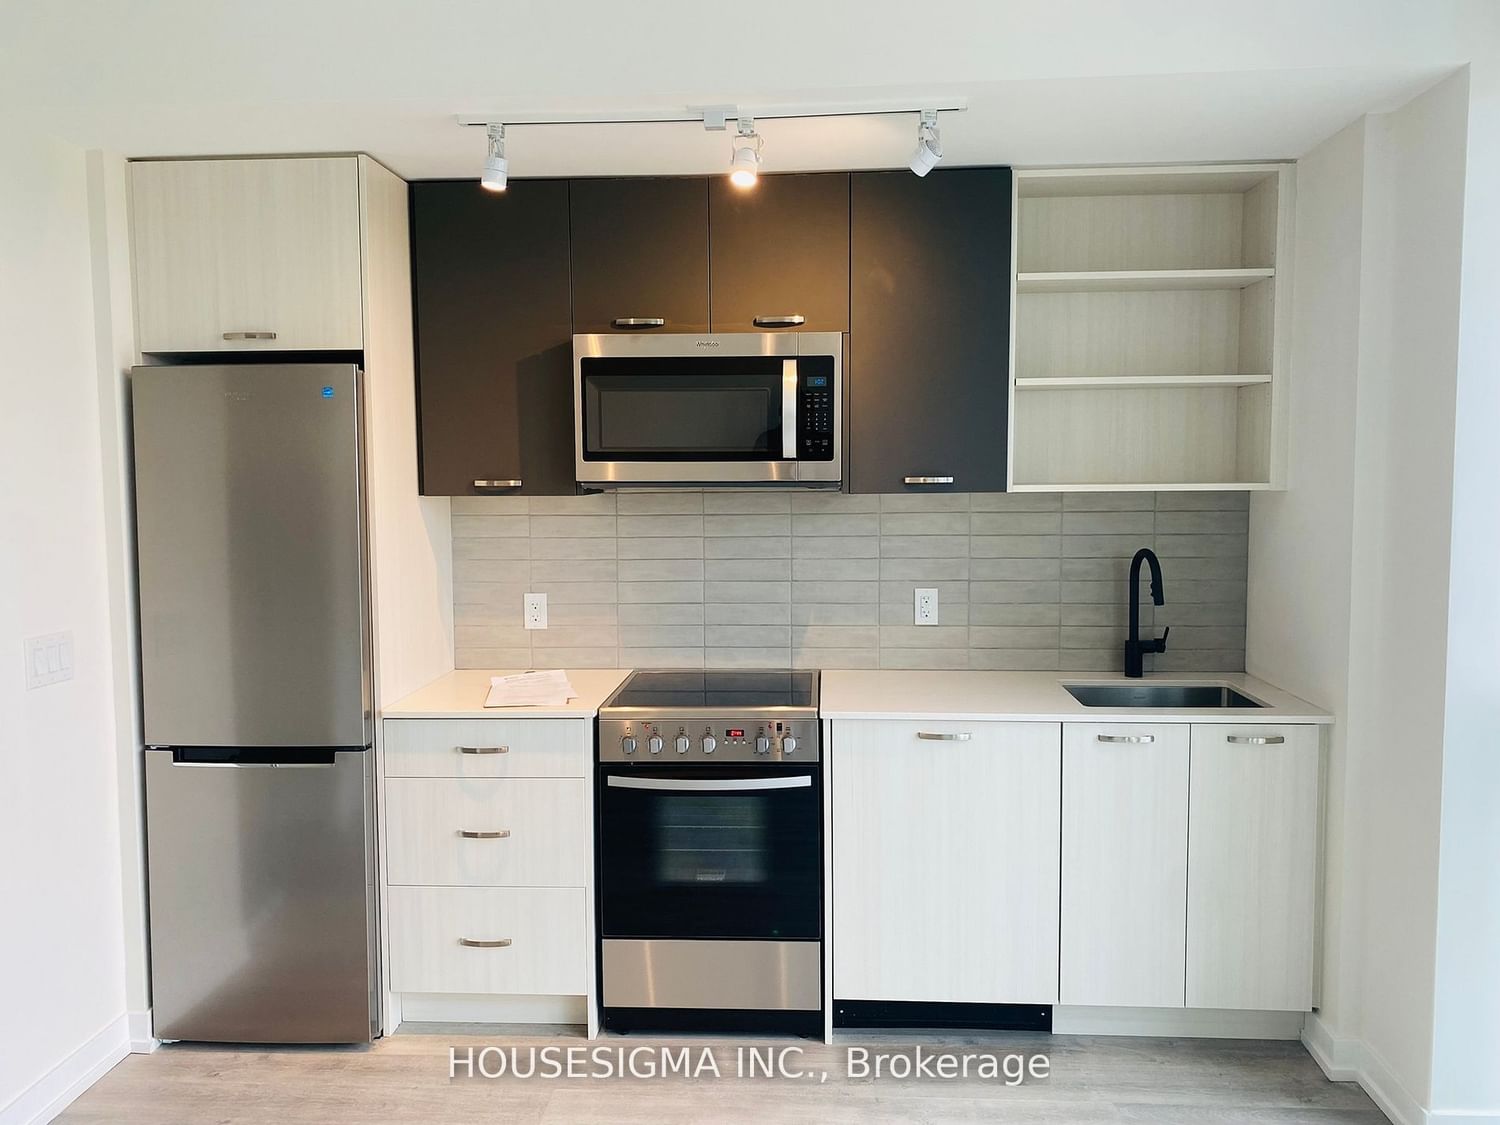
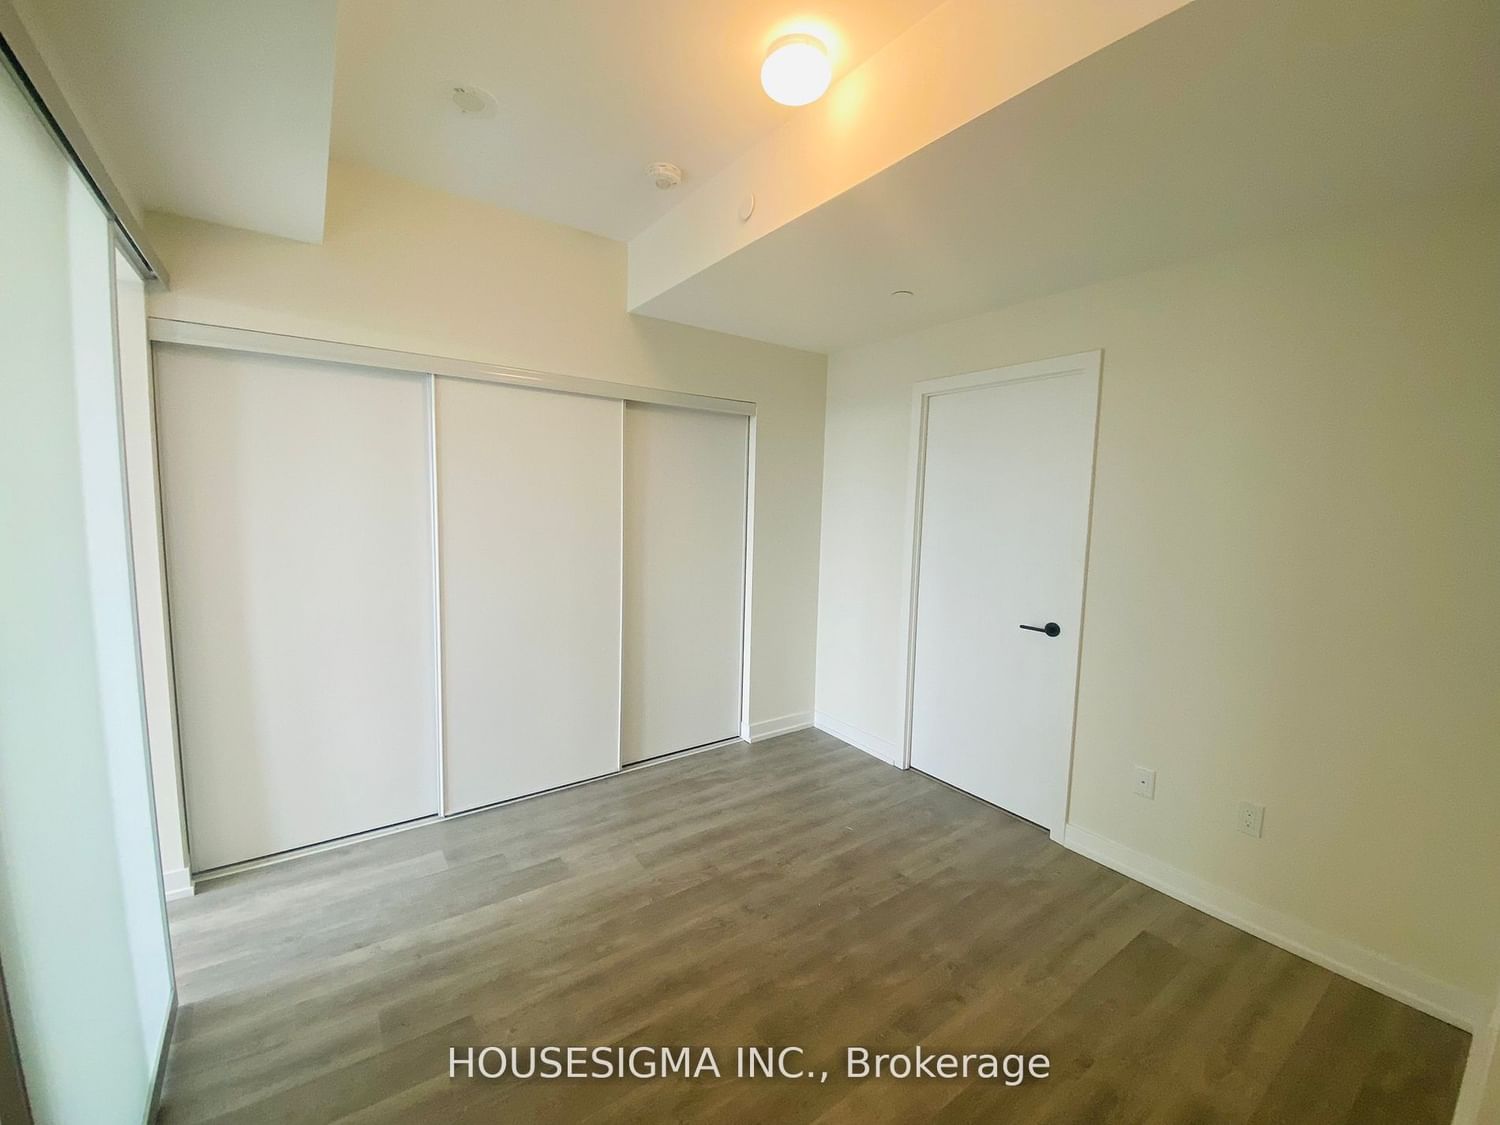
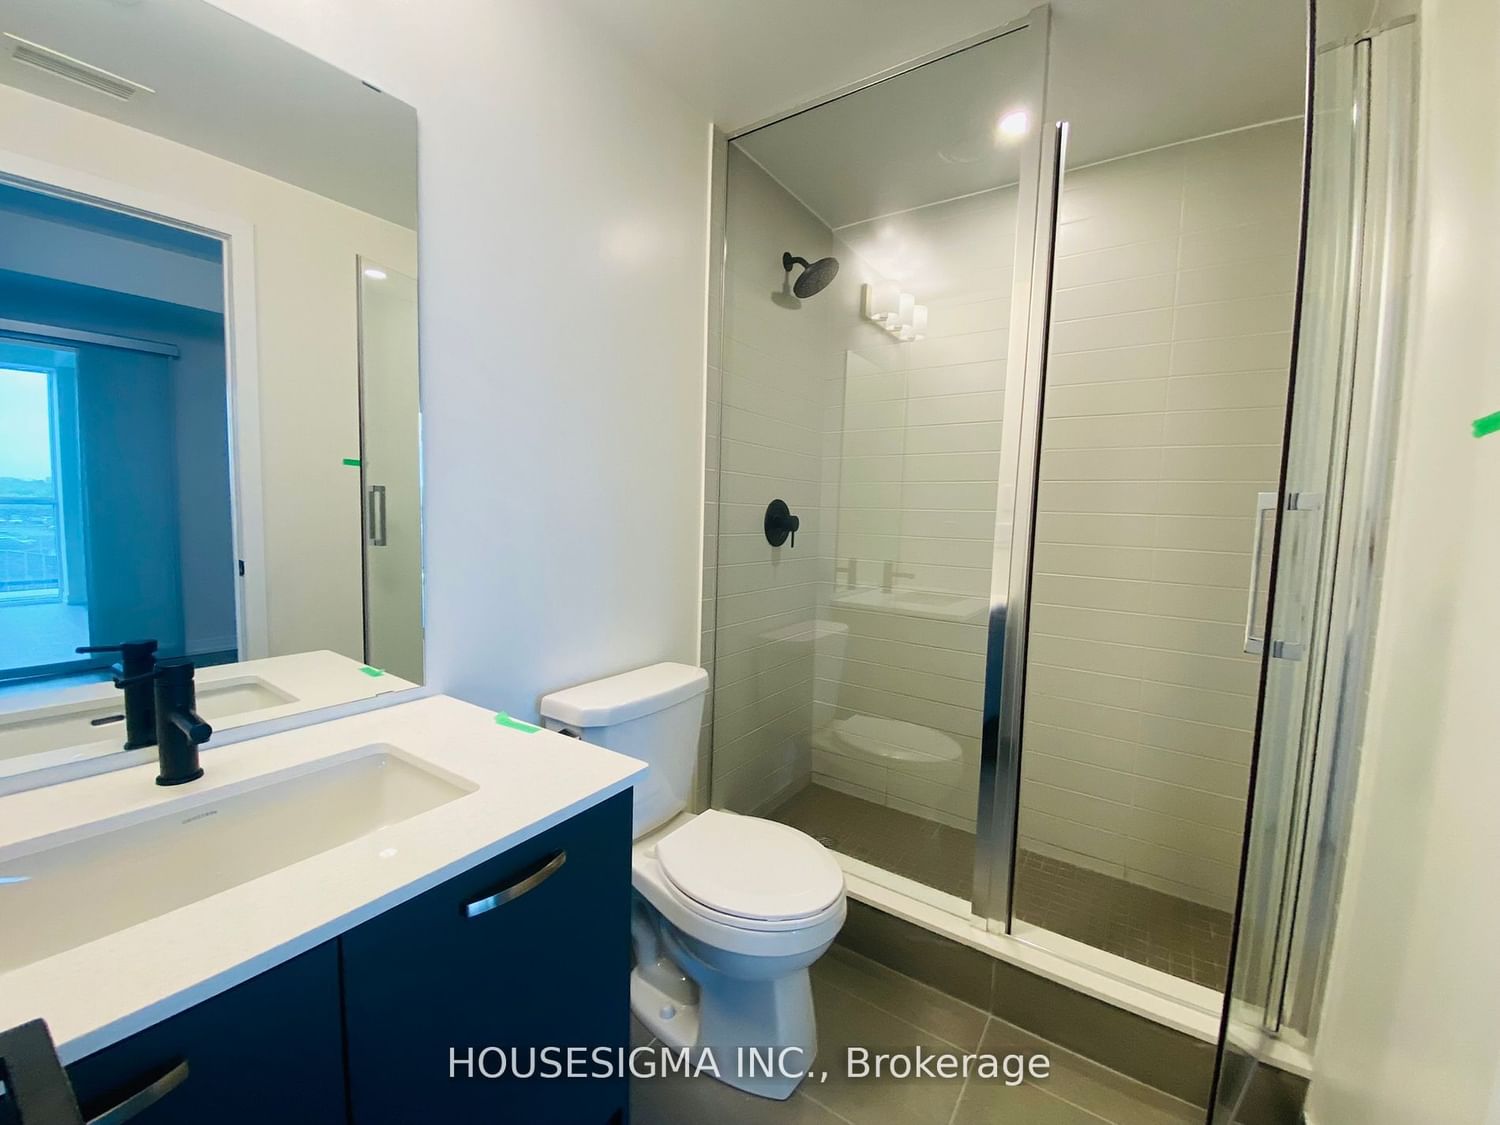
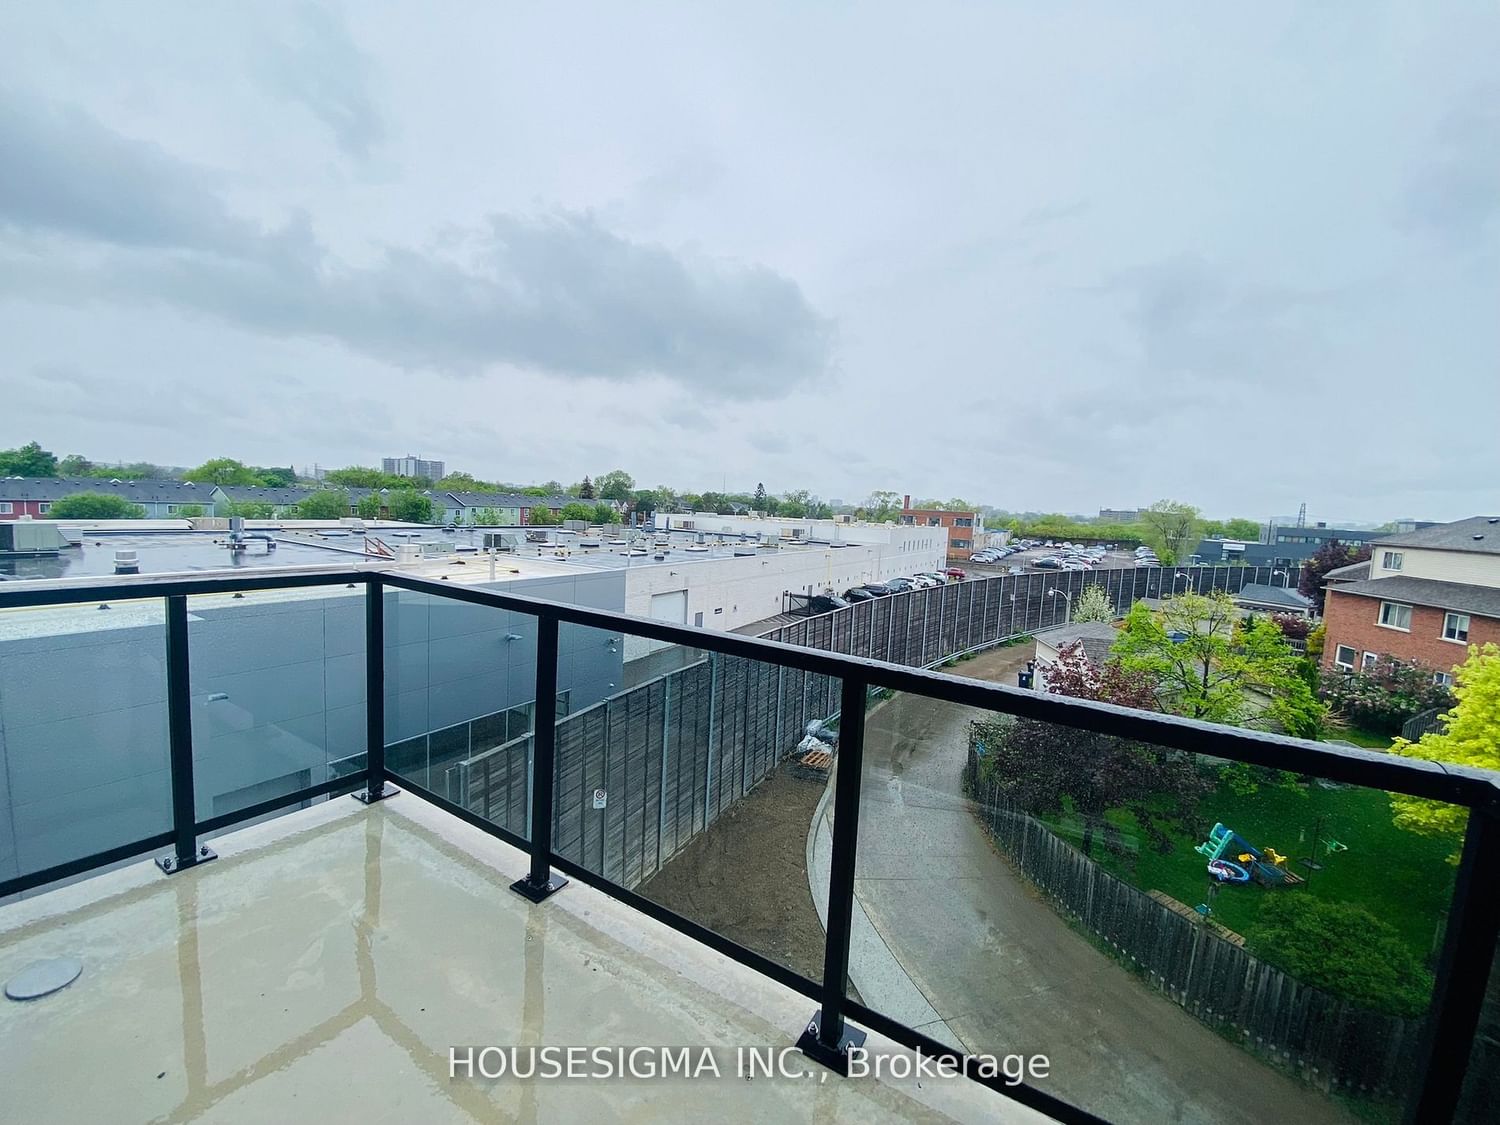
Brand New Luxurious Condo, In The Highly Sought After Junction Neighborhood. Bright & Spacious Floorplan W/North Exposure, Spacious Open Concept Layout Of 731Sqft Interior + Balcony Over-Looking Homes. Den can be used as a second bedroom due to newly installed modern glass sliding door. Modern Kitchen with Comfortable Open-Concept Living And Dining, High End Finishes And Great Location. This Luxury 1Br+Den & 2 Full WR With Open Concept Living And Kitchen In Toronto's Stockyards District Features Modern Design, S/S Appliances, Fitness Center And Rooftop Terrace. Minutes From TTC/Streetcar, Banks, Stock Yards Village, Metro Grocery, Canadian Tire, Shoppers Drug Mart, High Park & More.
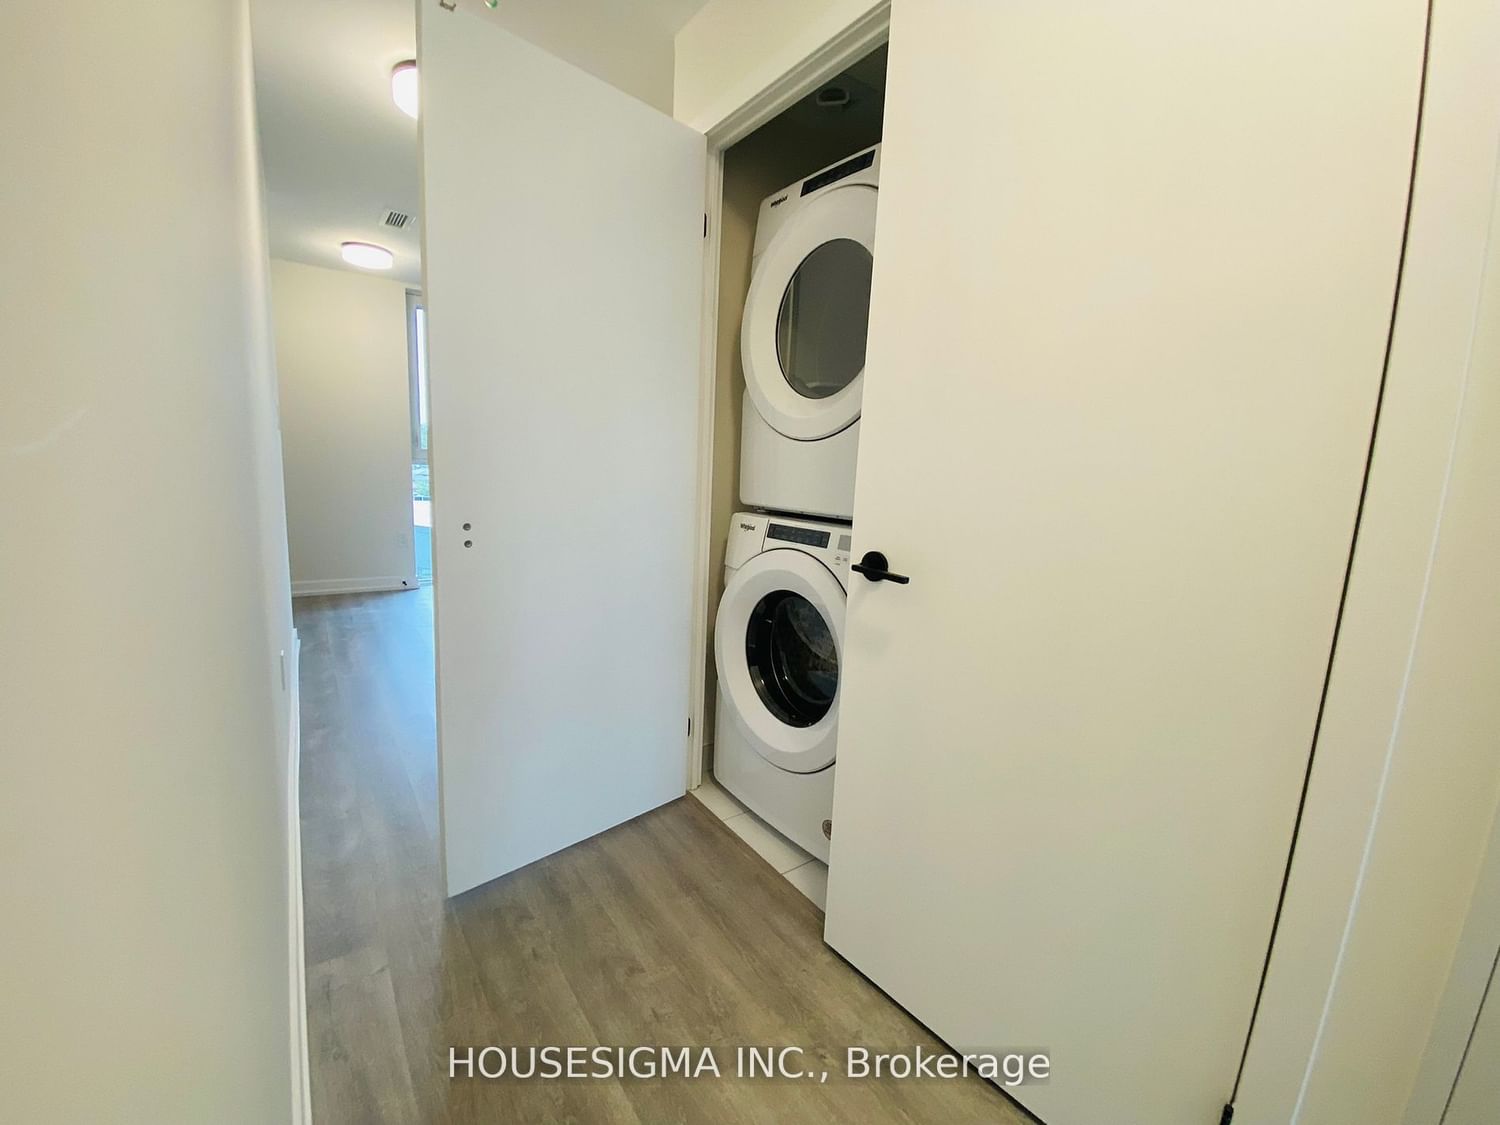
ExtrasSmooth Ceilings, Walk Out To Balcony, Laminate Flooring Throughout, Energy-Efficient Appliances, Quartz Counters & Matte Black Faucets. S/S: Fridge, Stove, Microwave, B/I Dishwasher & Hood Fan. Washer & Dryer.
housesigma inc.MLS® #W8012976
Amenities
Explore Neighbourhood
Similar Listings
Demographics
Based on the dissemination area as defined by Statistics Canada. A dissemination area contains, on average, approximately 200 – 400 households.
Price Trends
Maintenance Fees
Building Trends At Stockyard District Condos
Days on Strata
List vs Selling Price
Offer Competition
Turnover of Units
Property Value
Price Ranking
Sold Units
Rented Units
Best Value Rank
Appreciation Rank
Rental Yield
High Demand
Transaction Insights at 2300 St Clair Avenue W
| 1 Bed | 1 Bed + Den | 2 Bed | 2 Bed + Den | 3 Bed | 3 Bed + Den | |
|---|---|---|---|---|---|---|
| Price Range | $480,116 - $510,000 | $520,000 - $550,000 | $599,000 - $618,000 | $600,000 | No Data | No Data |
| Avg. Cost Per Sqft | $944 | $949 | $687 | $792 | No Data | No Data |
| Price Range | $1,800 - $2,700 | $2,200 - $2,650 | $2,700 - $3,100 | $2,800 - $3,200 | $3,600 - $3,995 | No Data |
| Avg. Wait for Unit Availability | 185 Days | 142 Days | 28 Days | 244 Days | No Data | No Data |
| Avg. Wait for Unit Availability | 27 Days | 11 Days | 19 Days | 24 Days | 104 Days | 4 Days |
| Ratio of Units in Building | 16% | 39% | 17% | 18% | 6% | 5% |
Transactions vs Inventory
Total number of units listed and sold in Junction - West End
