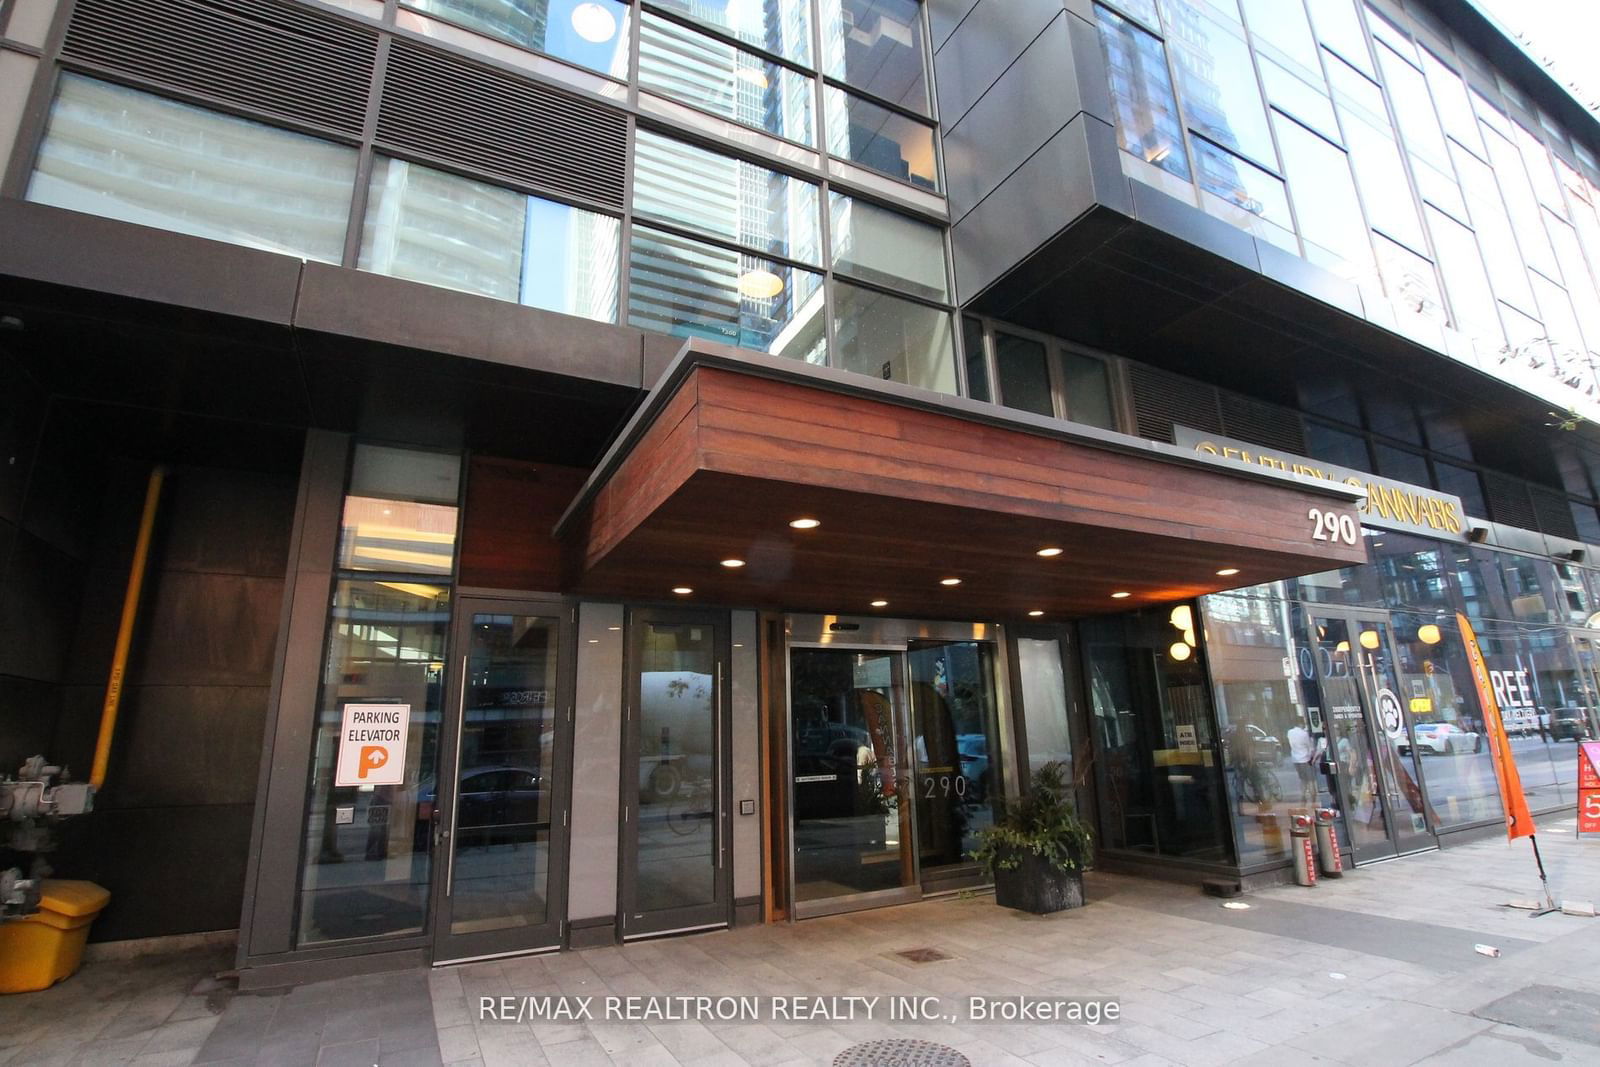
1607 - 290 Adelaide St W
Listing History
Unit Highlights
Maintenance Fees
Utility Type
- Air Conditioning
- Central Air
- Heat Source
- Gas
- Heating
- Forced Air
Room Dimensions
About this Listing
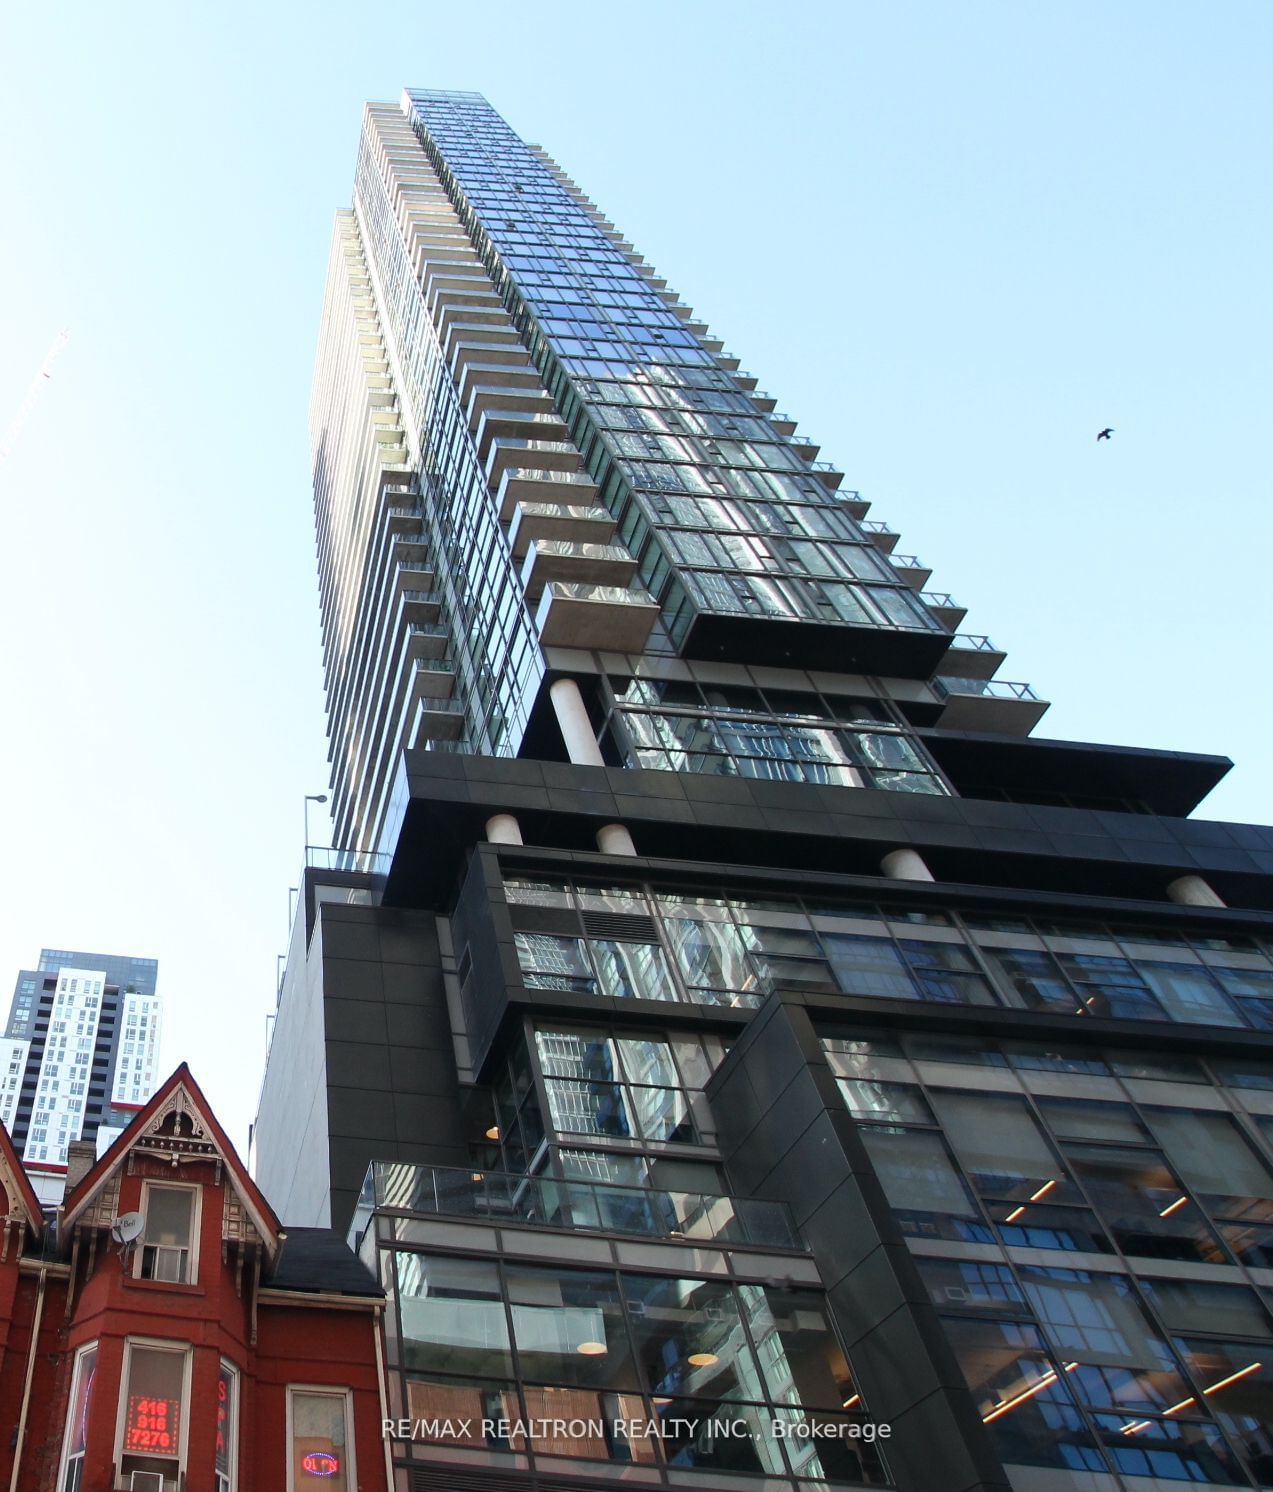
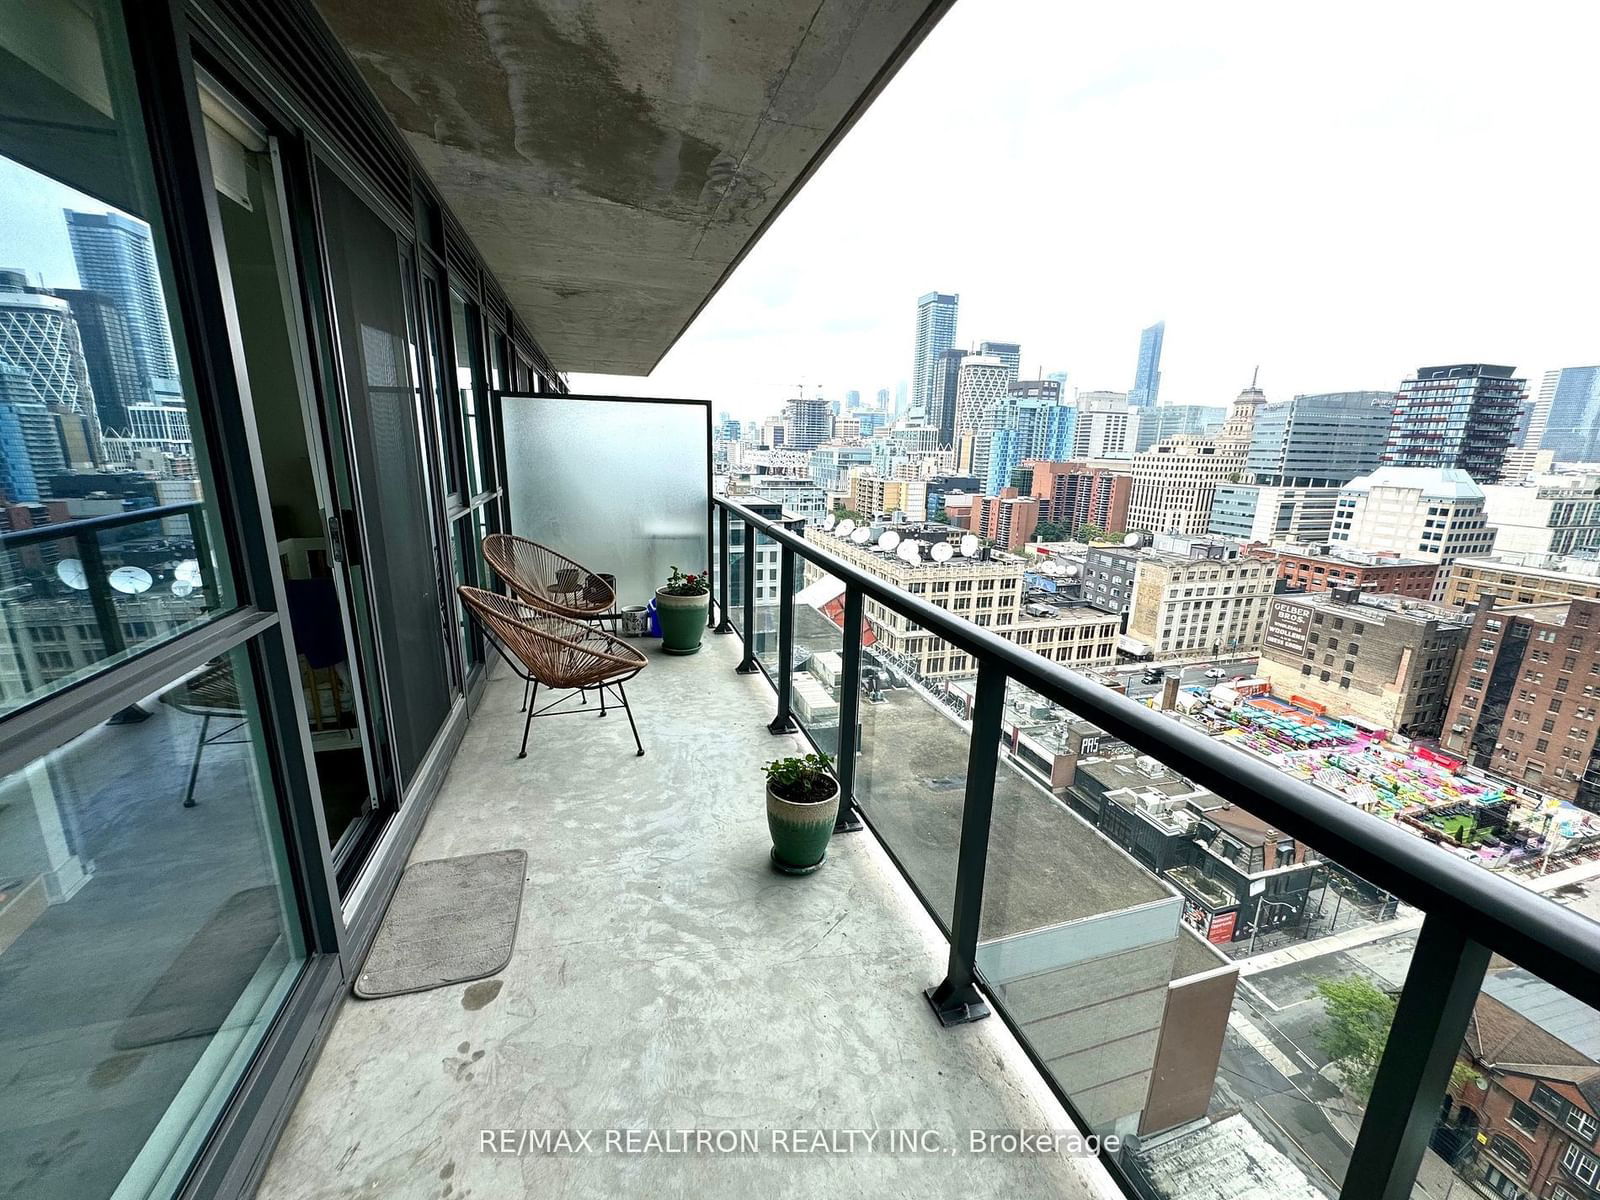
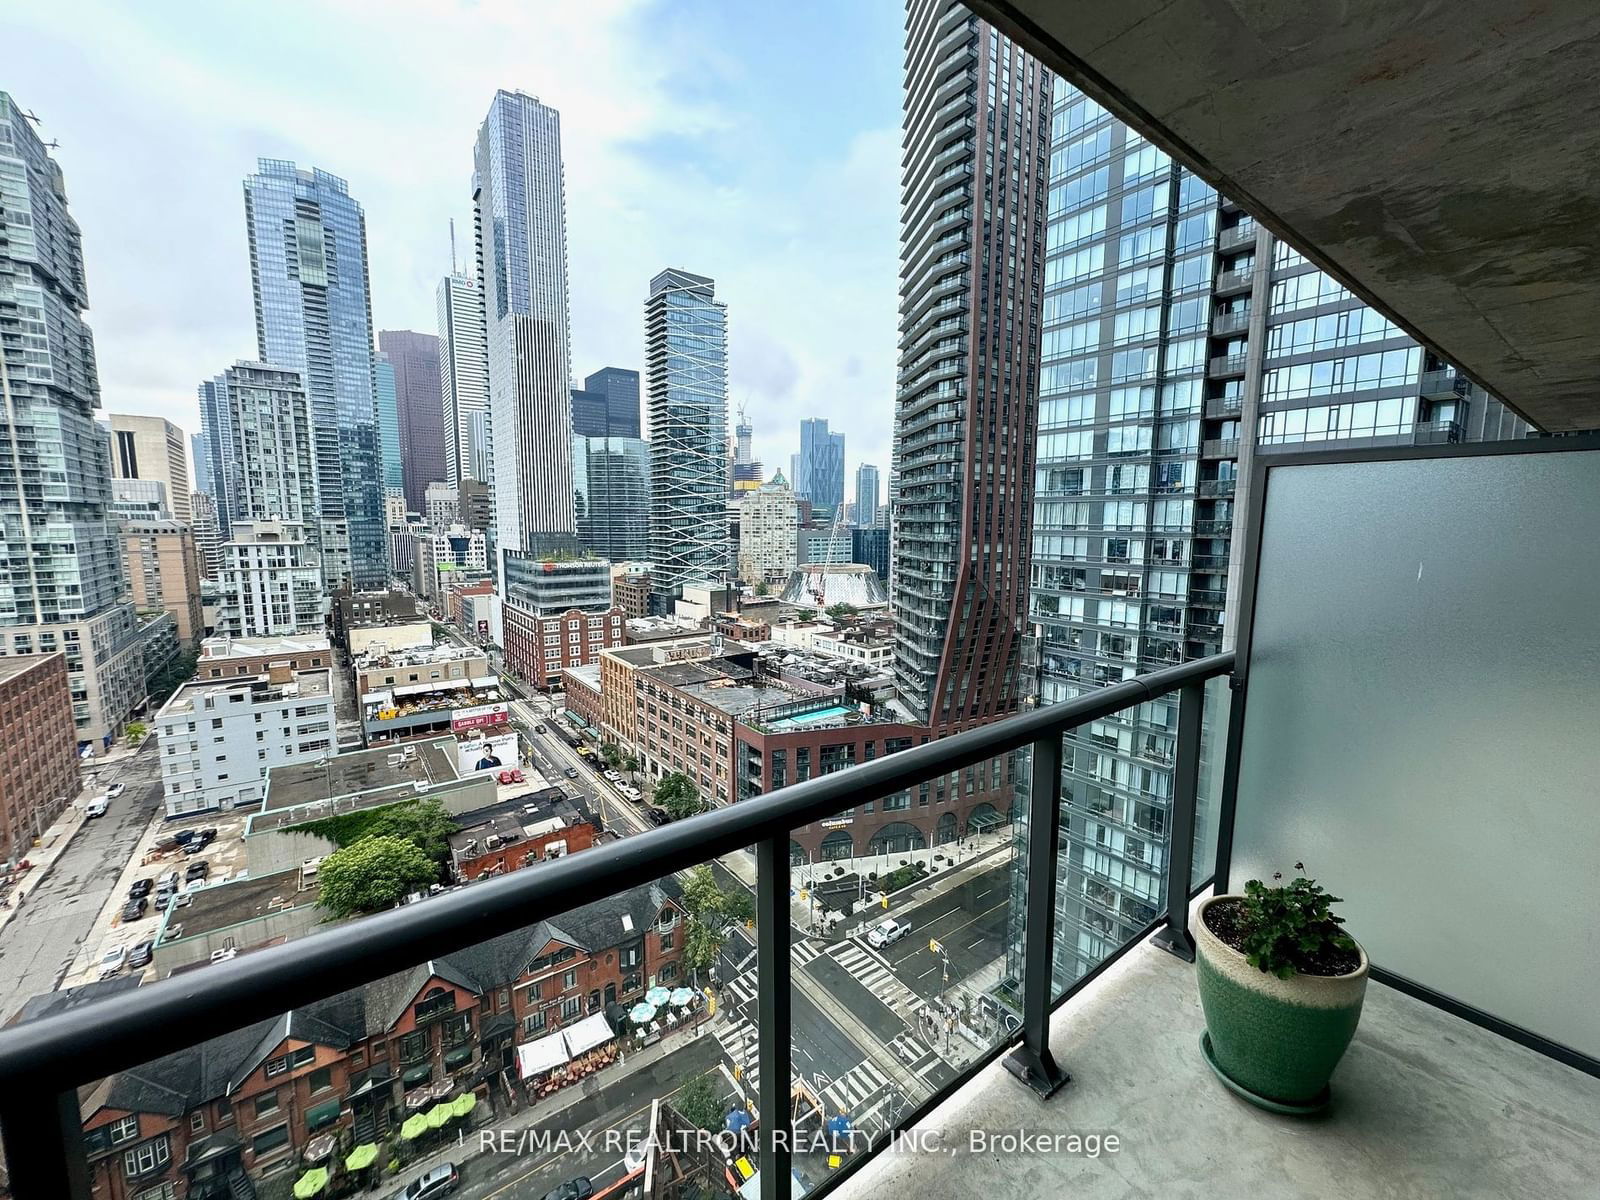
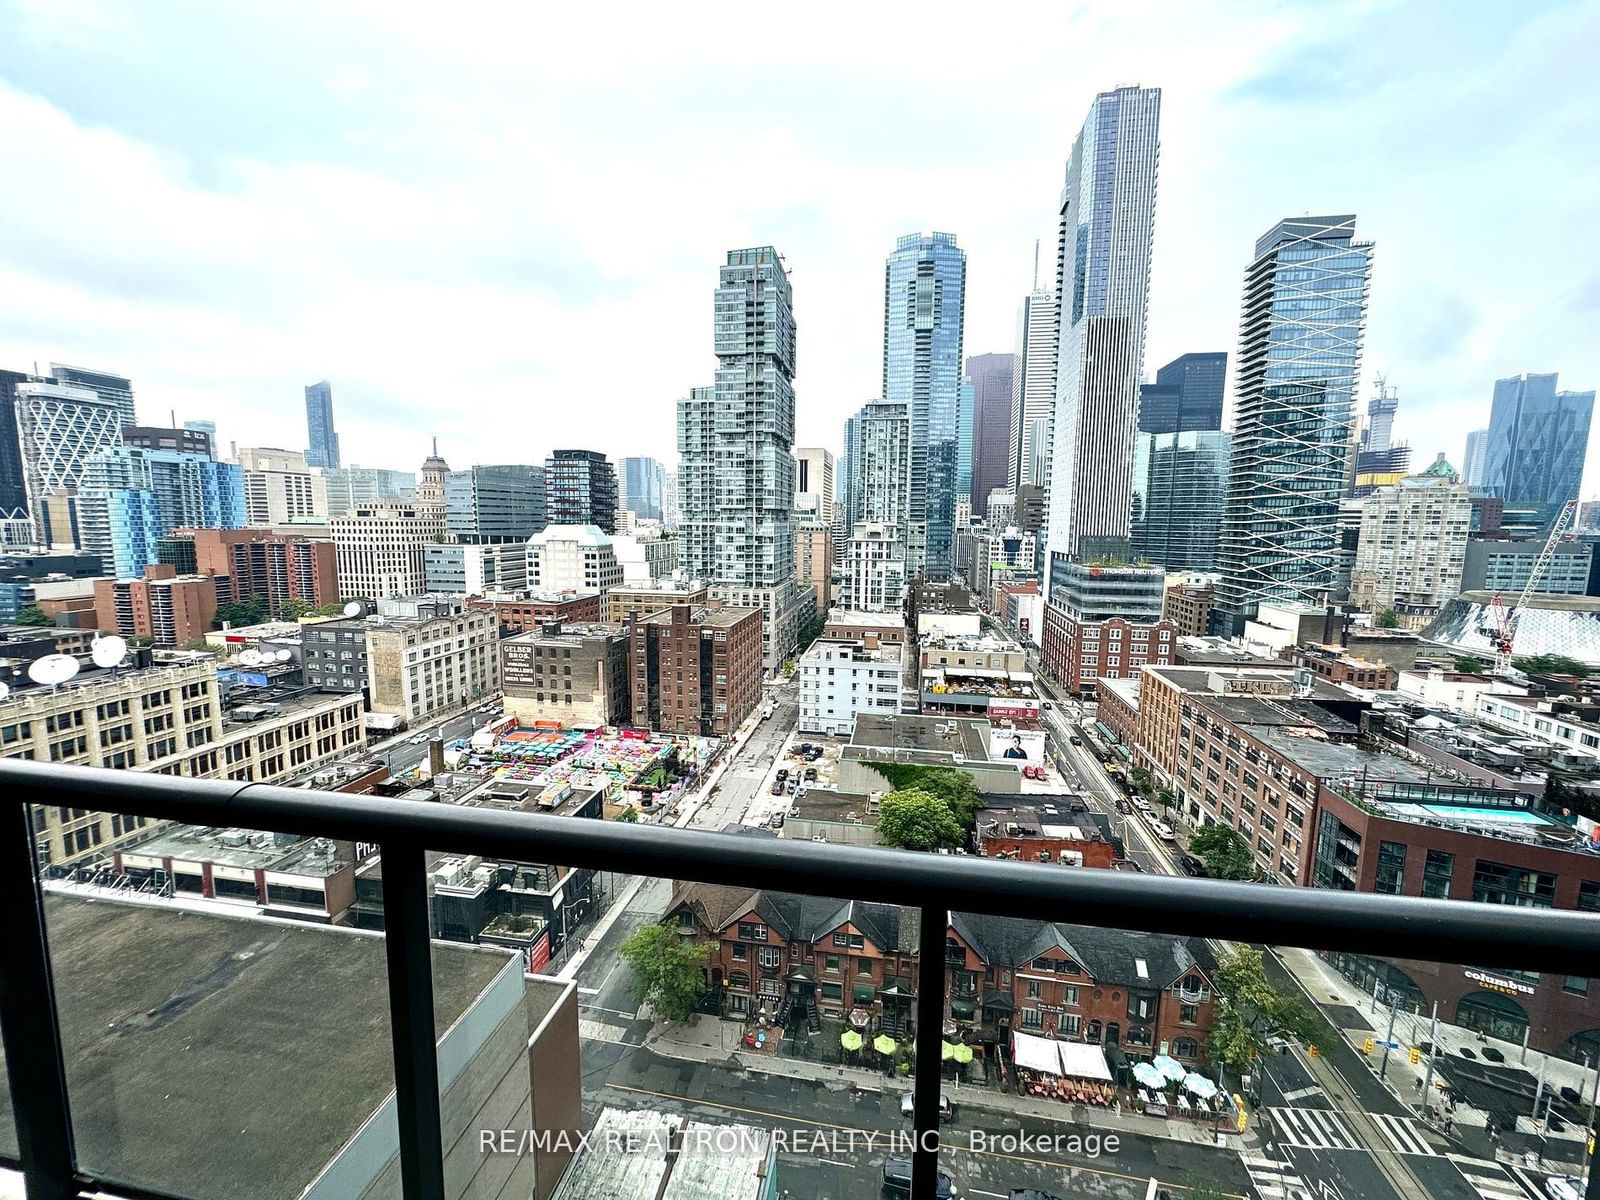
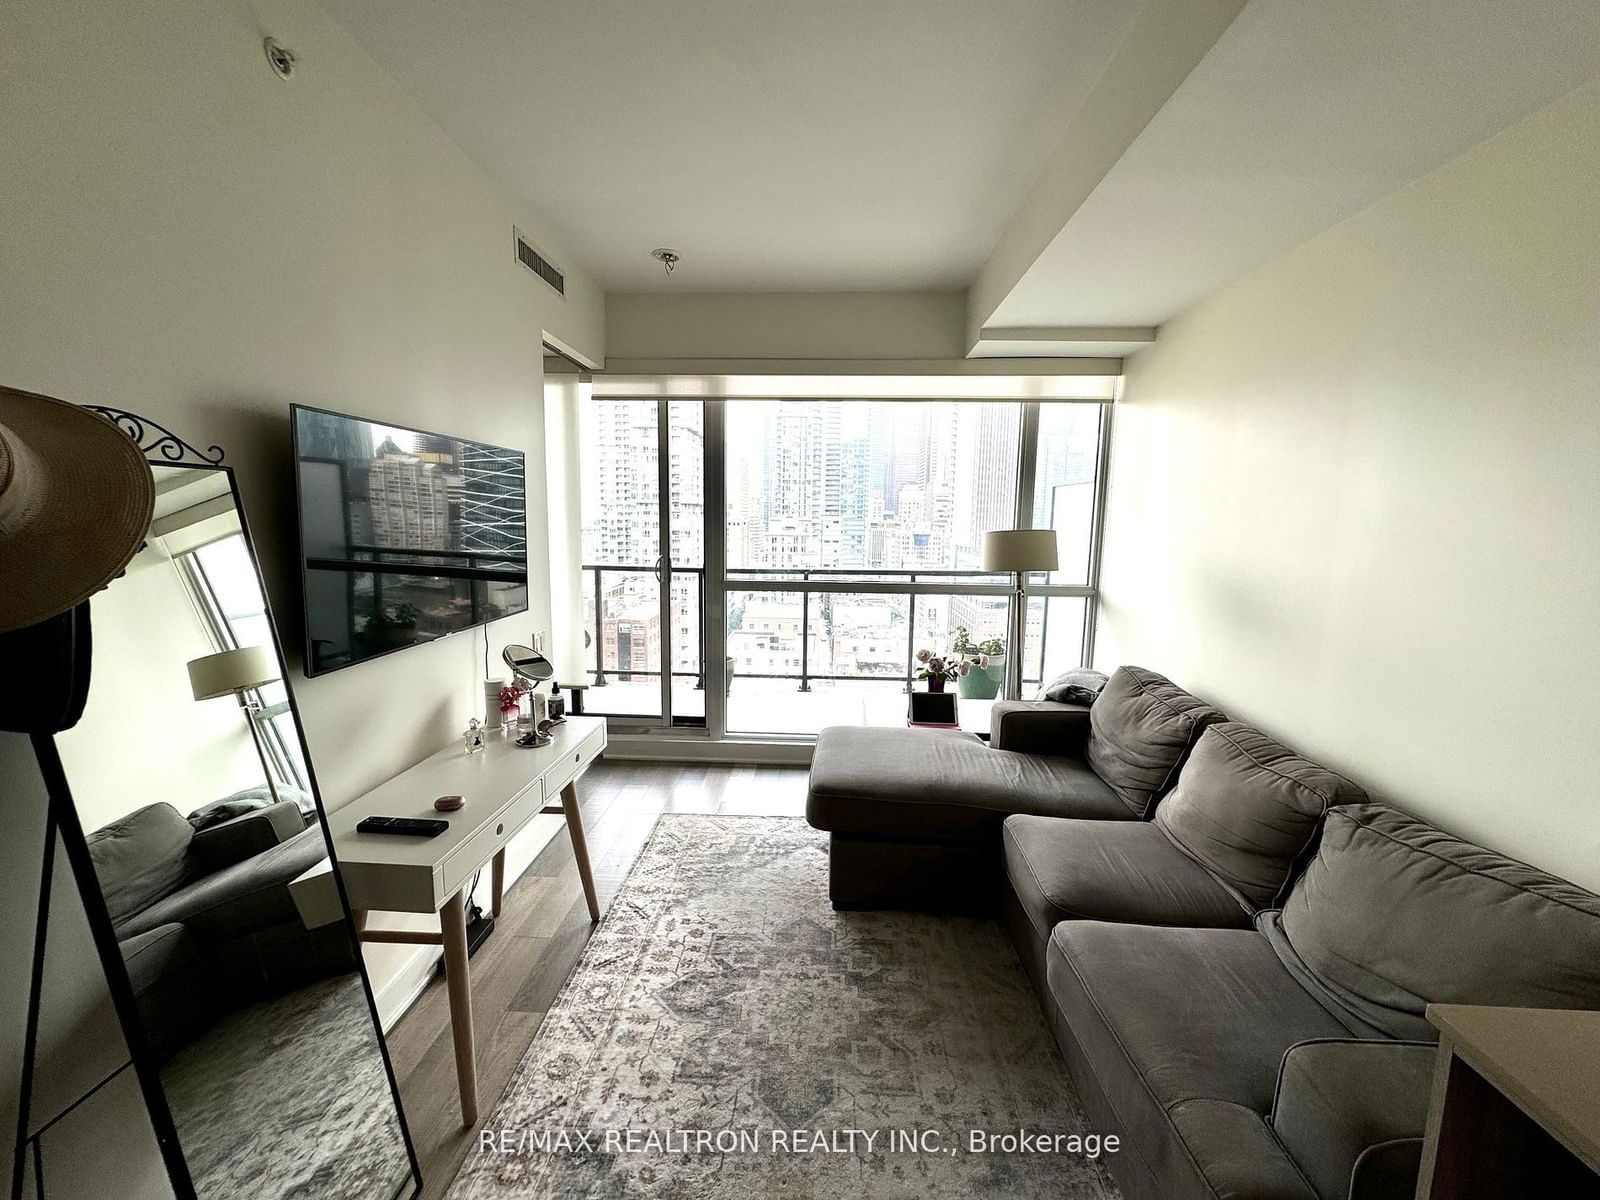
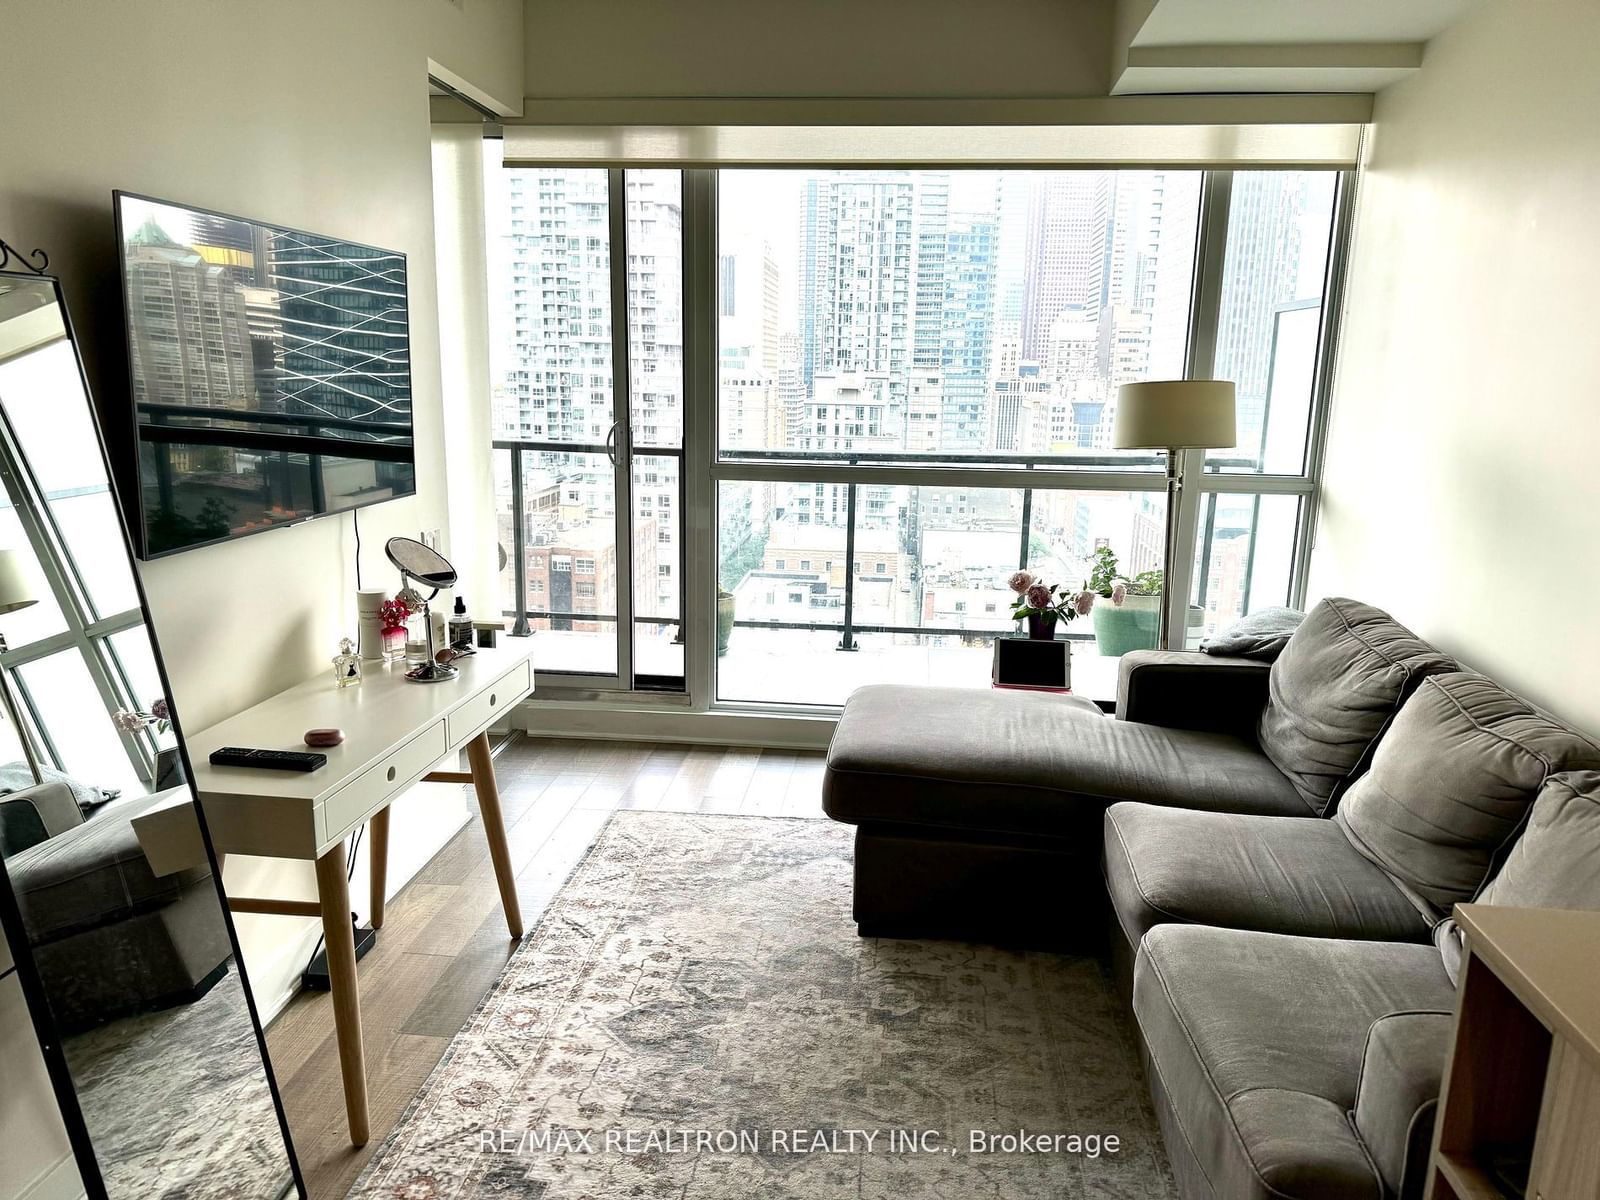
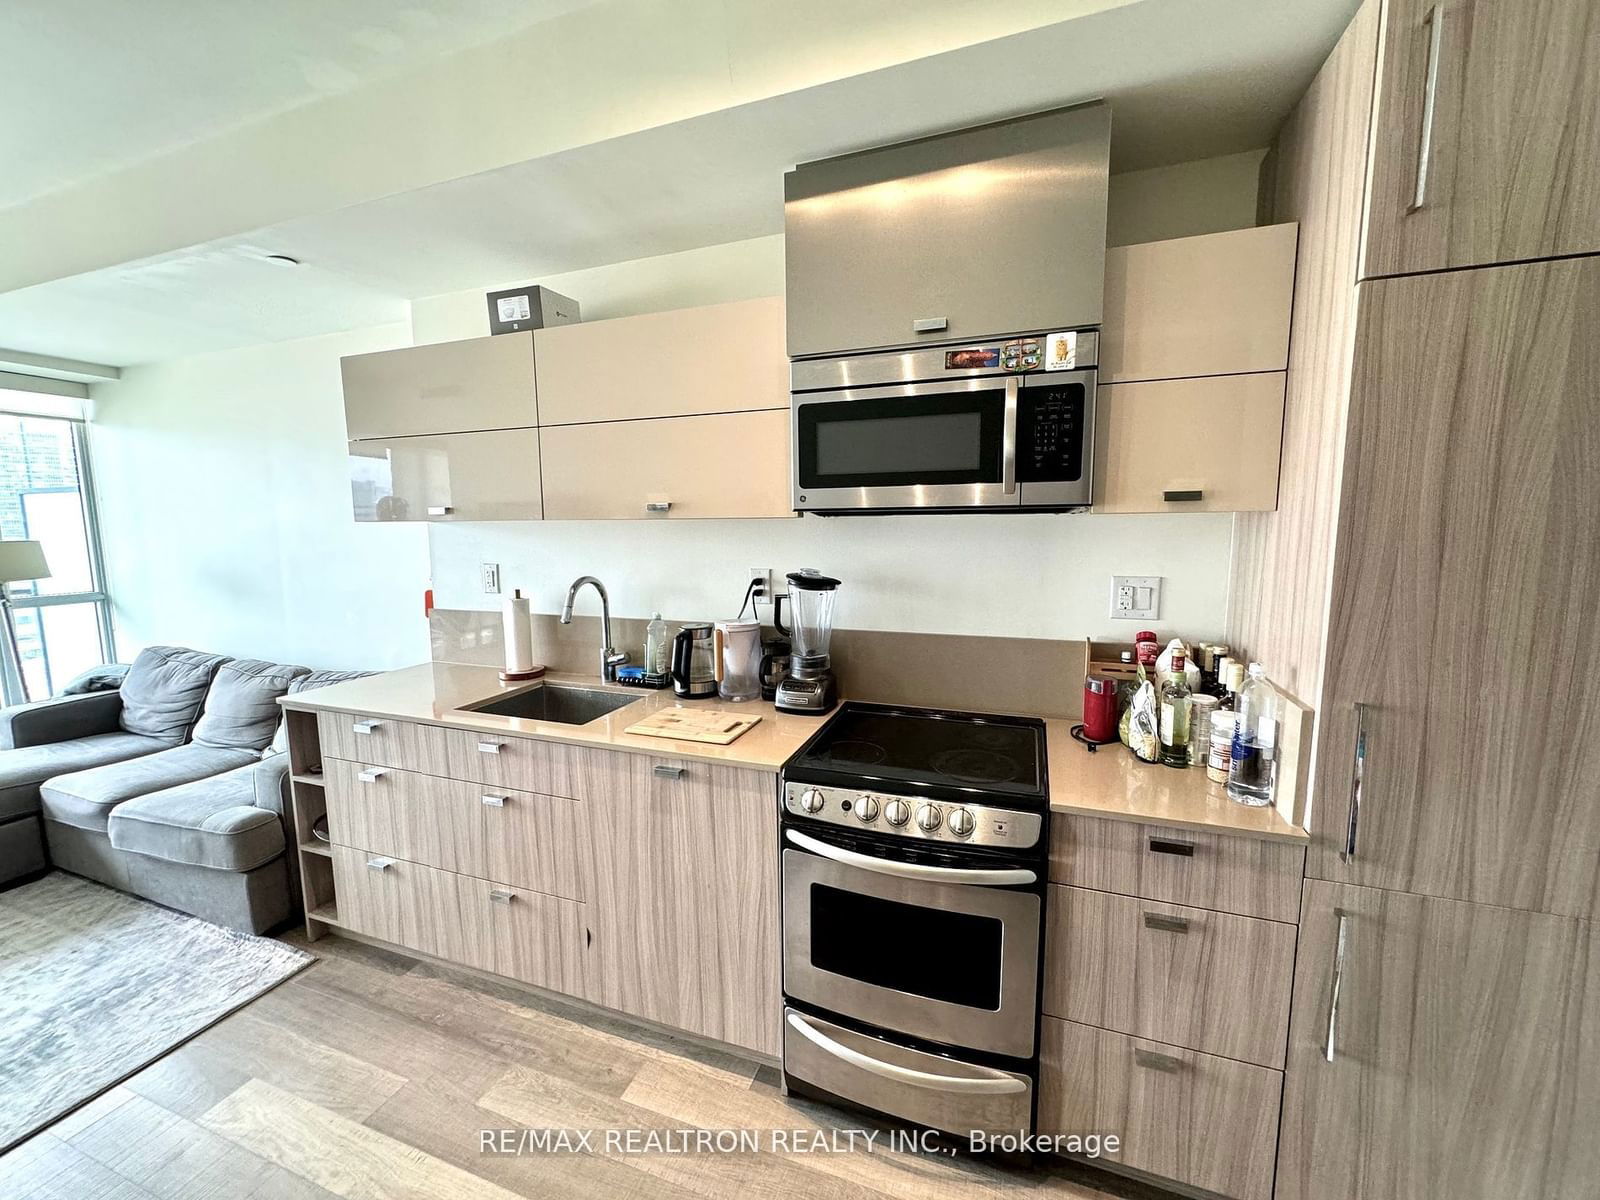
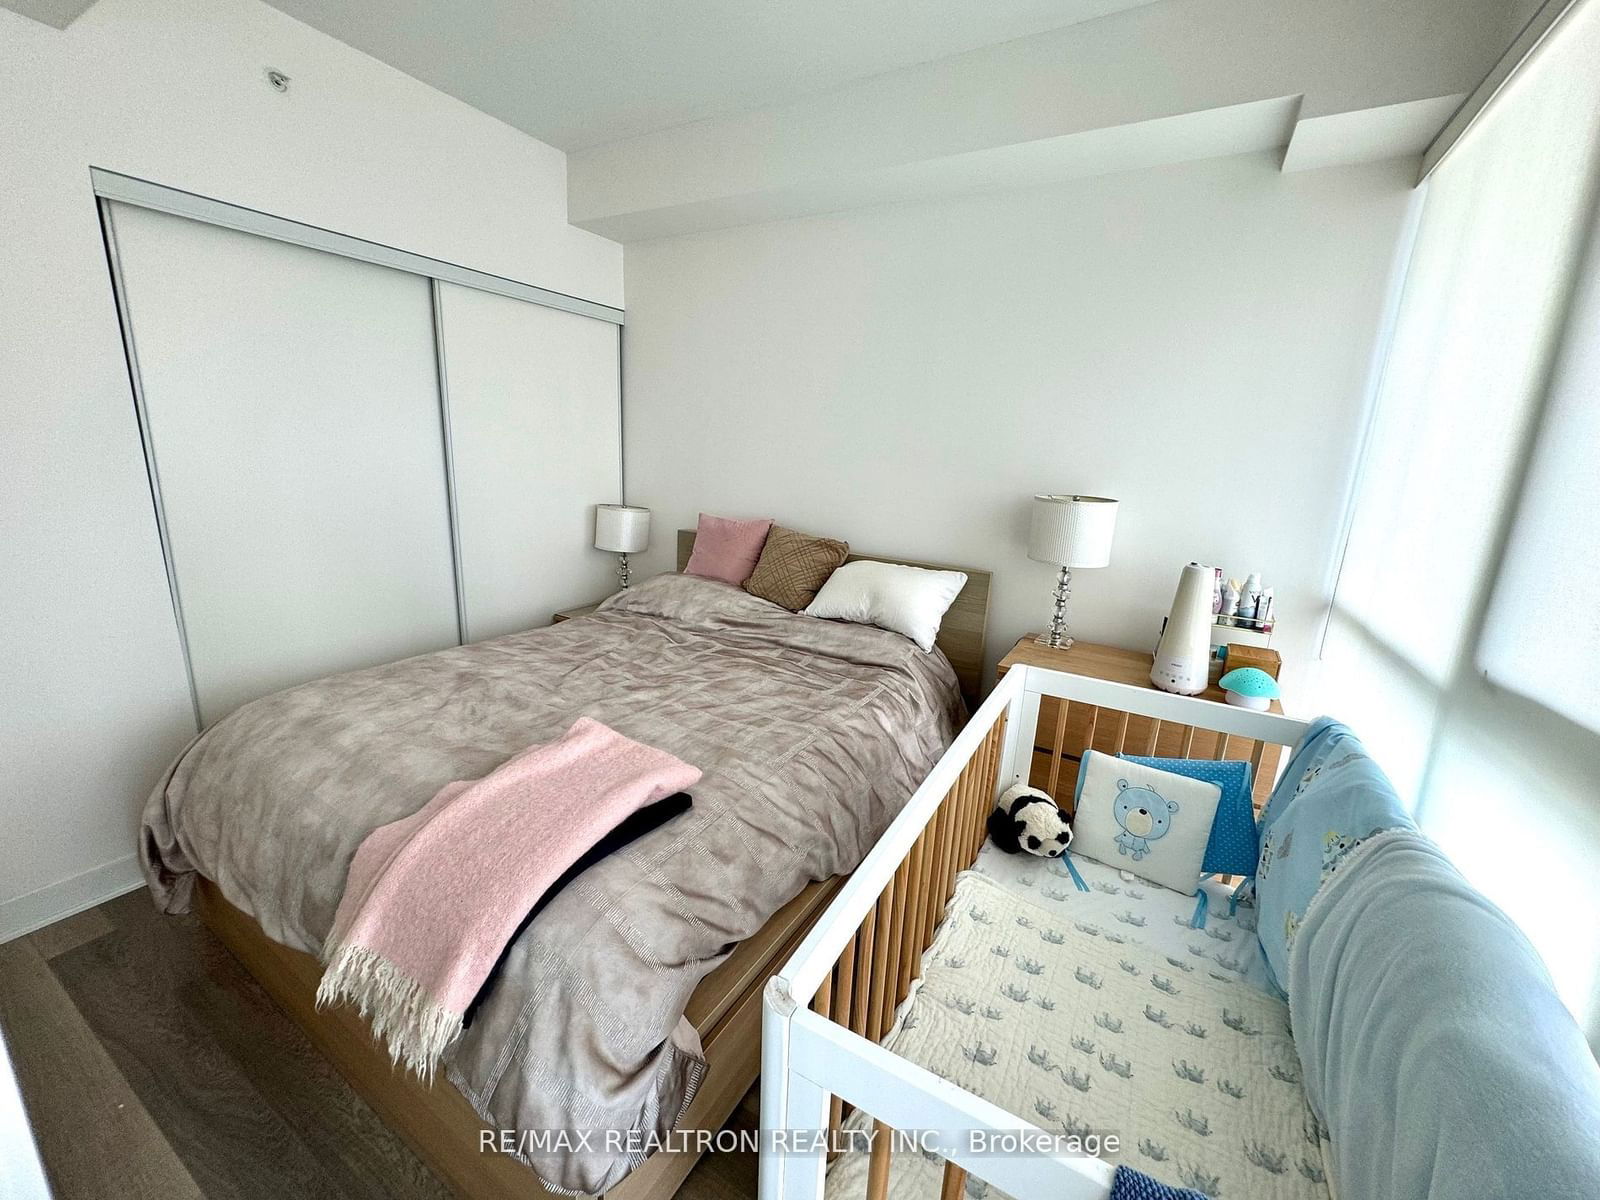
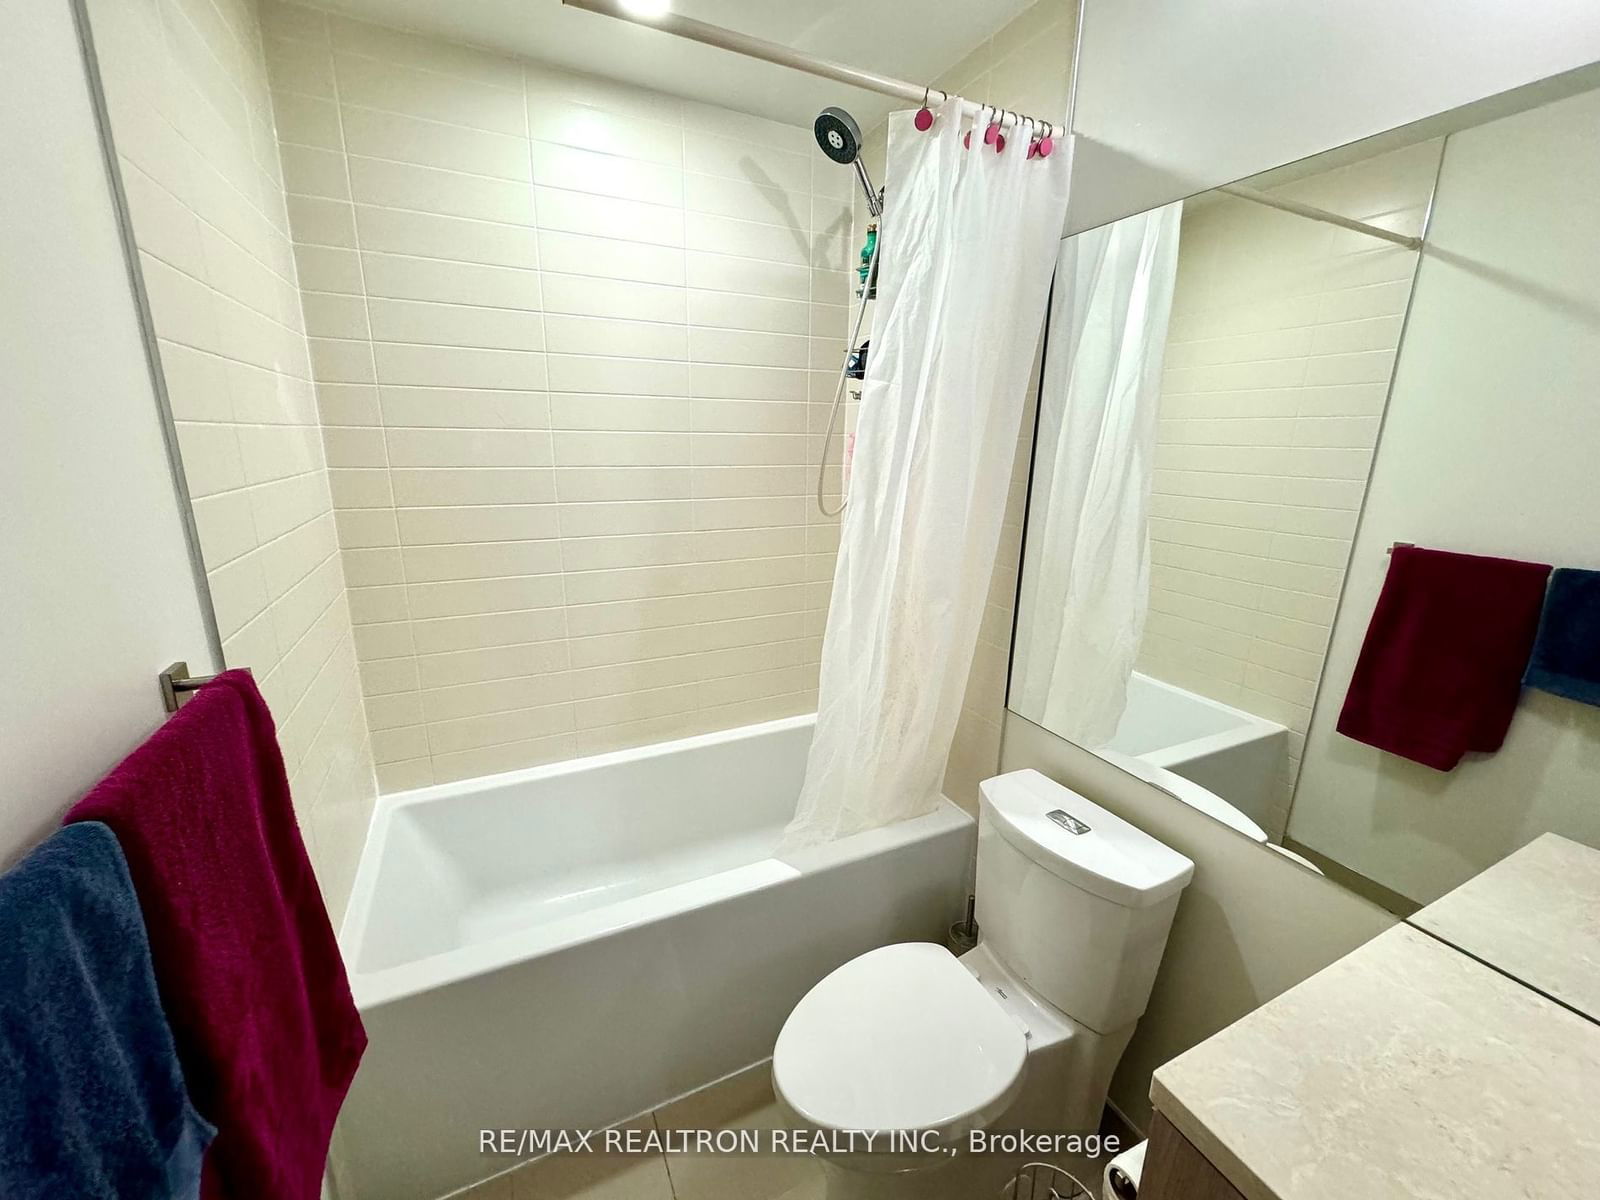
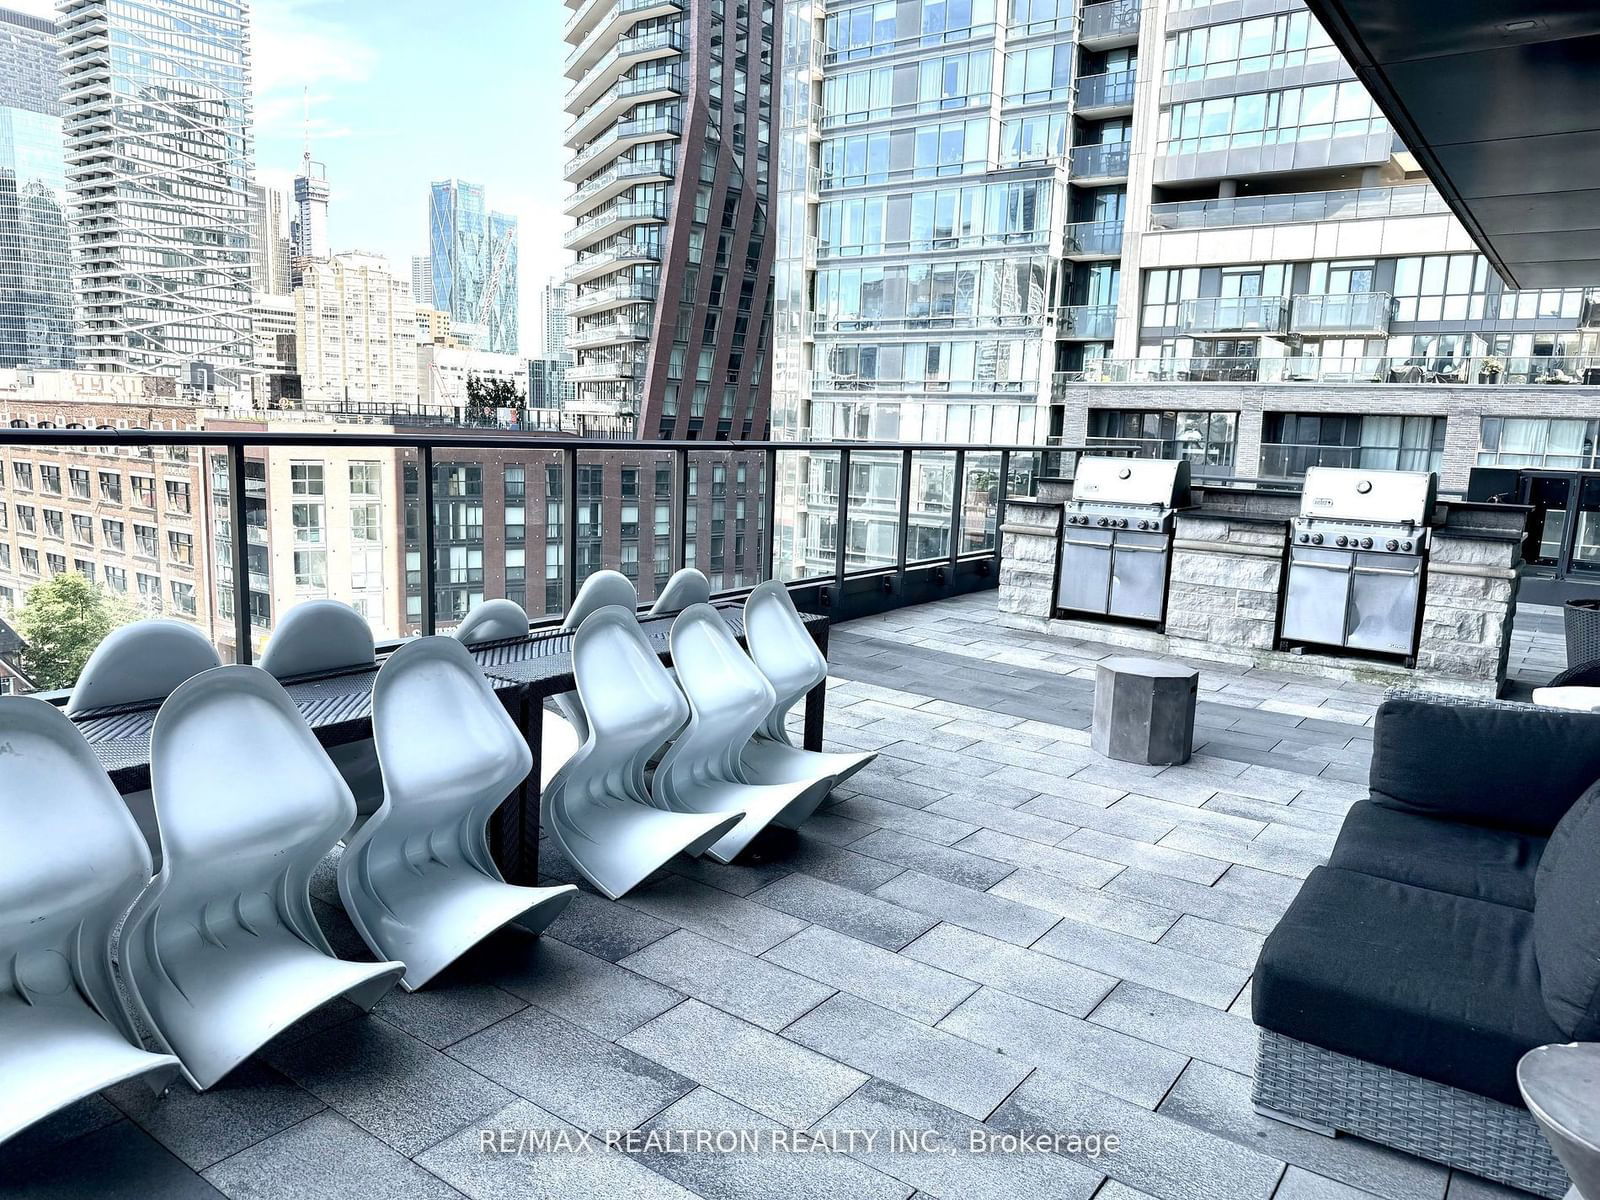
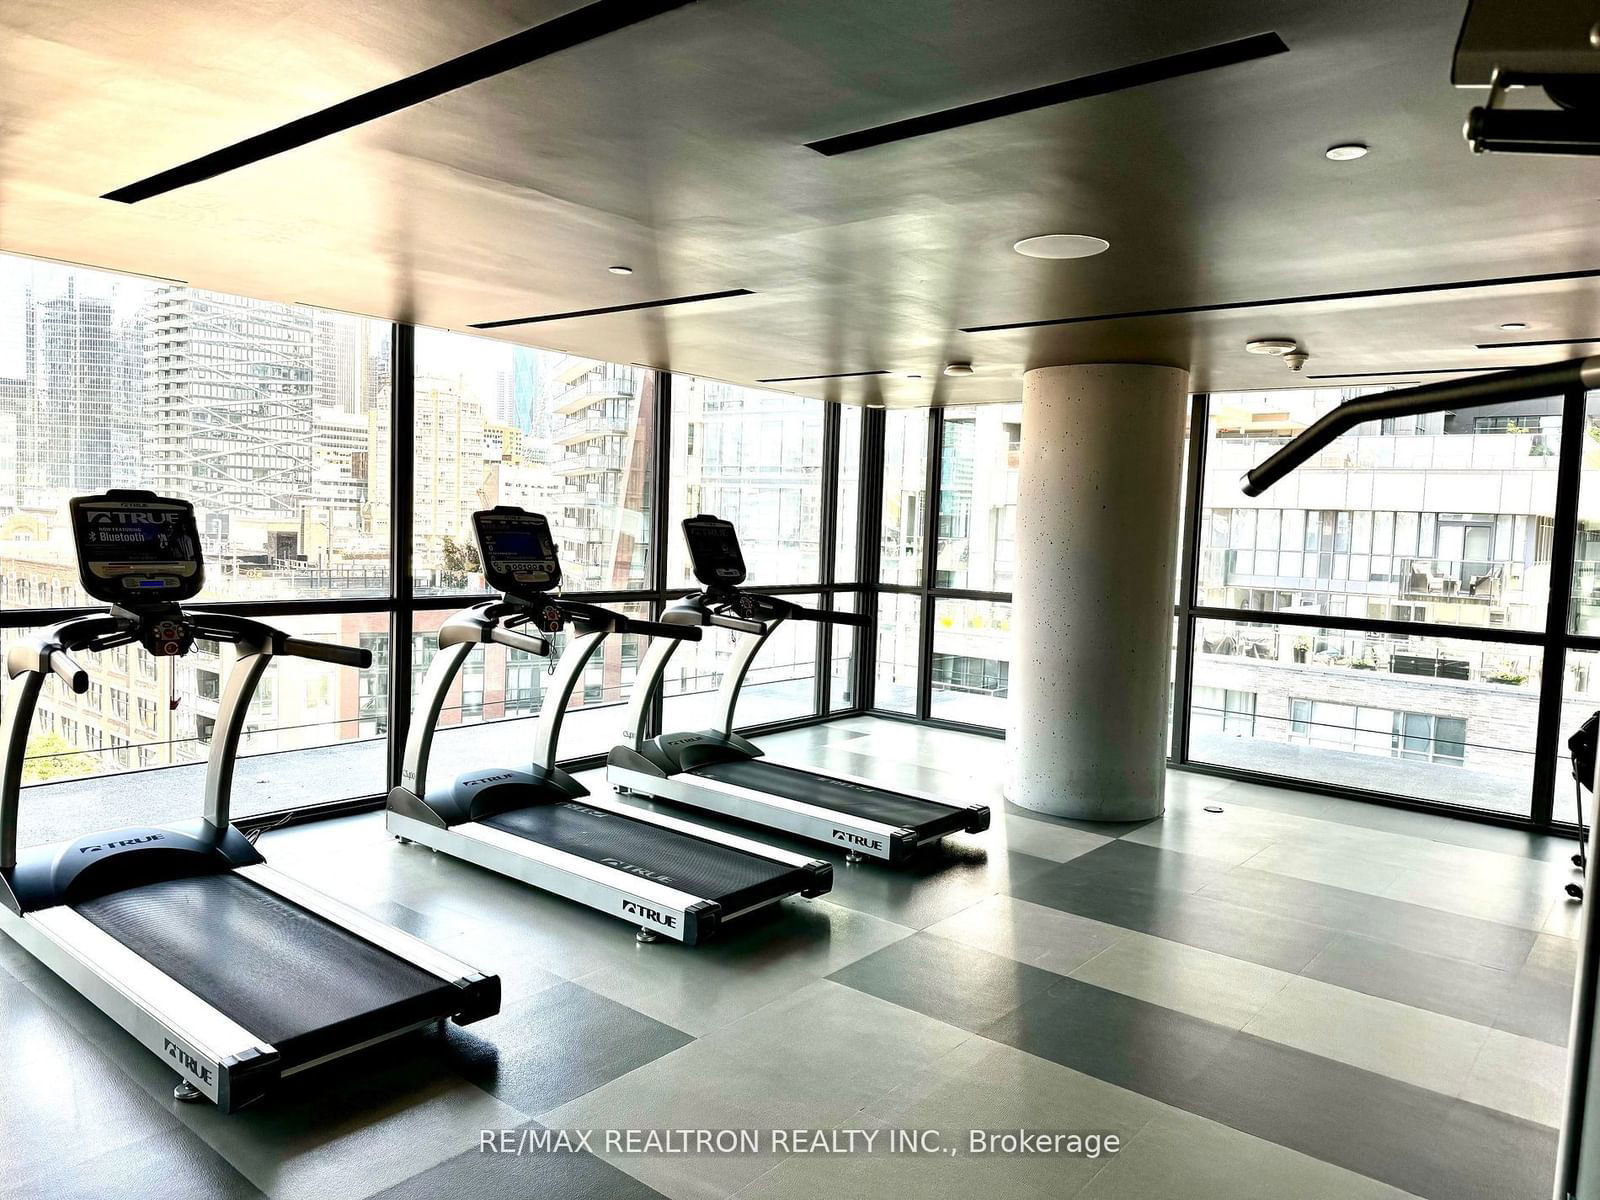
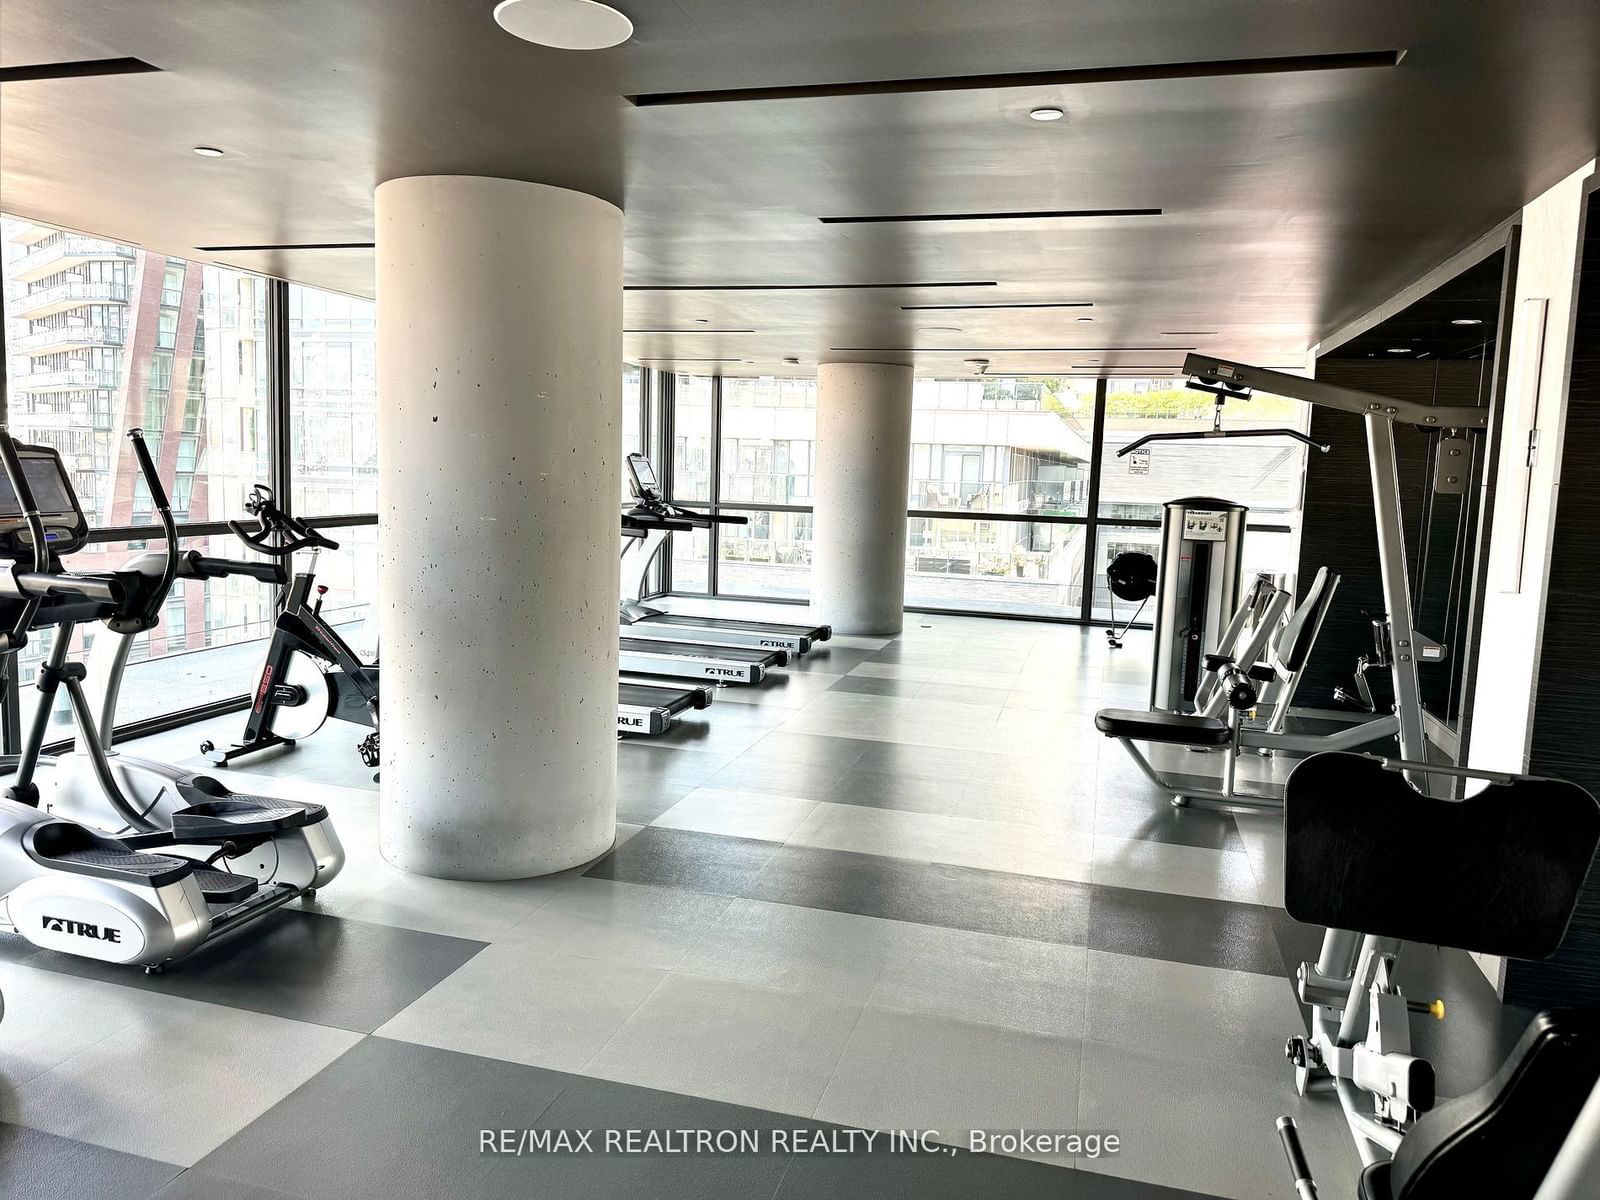
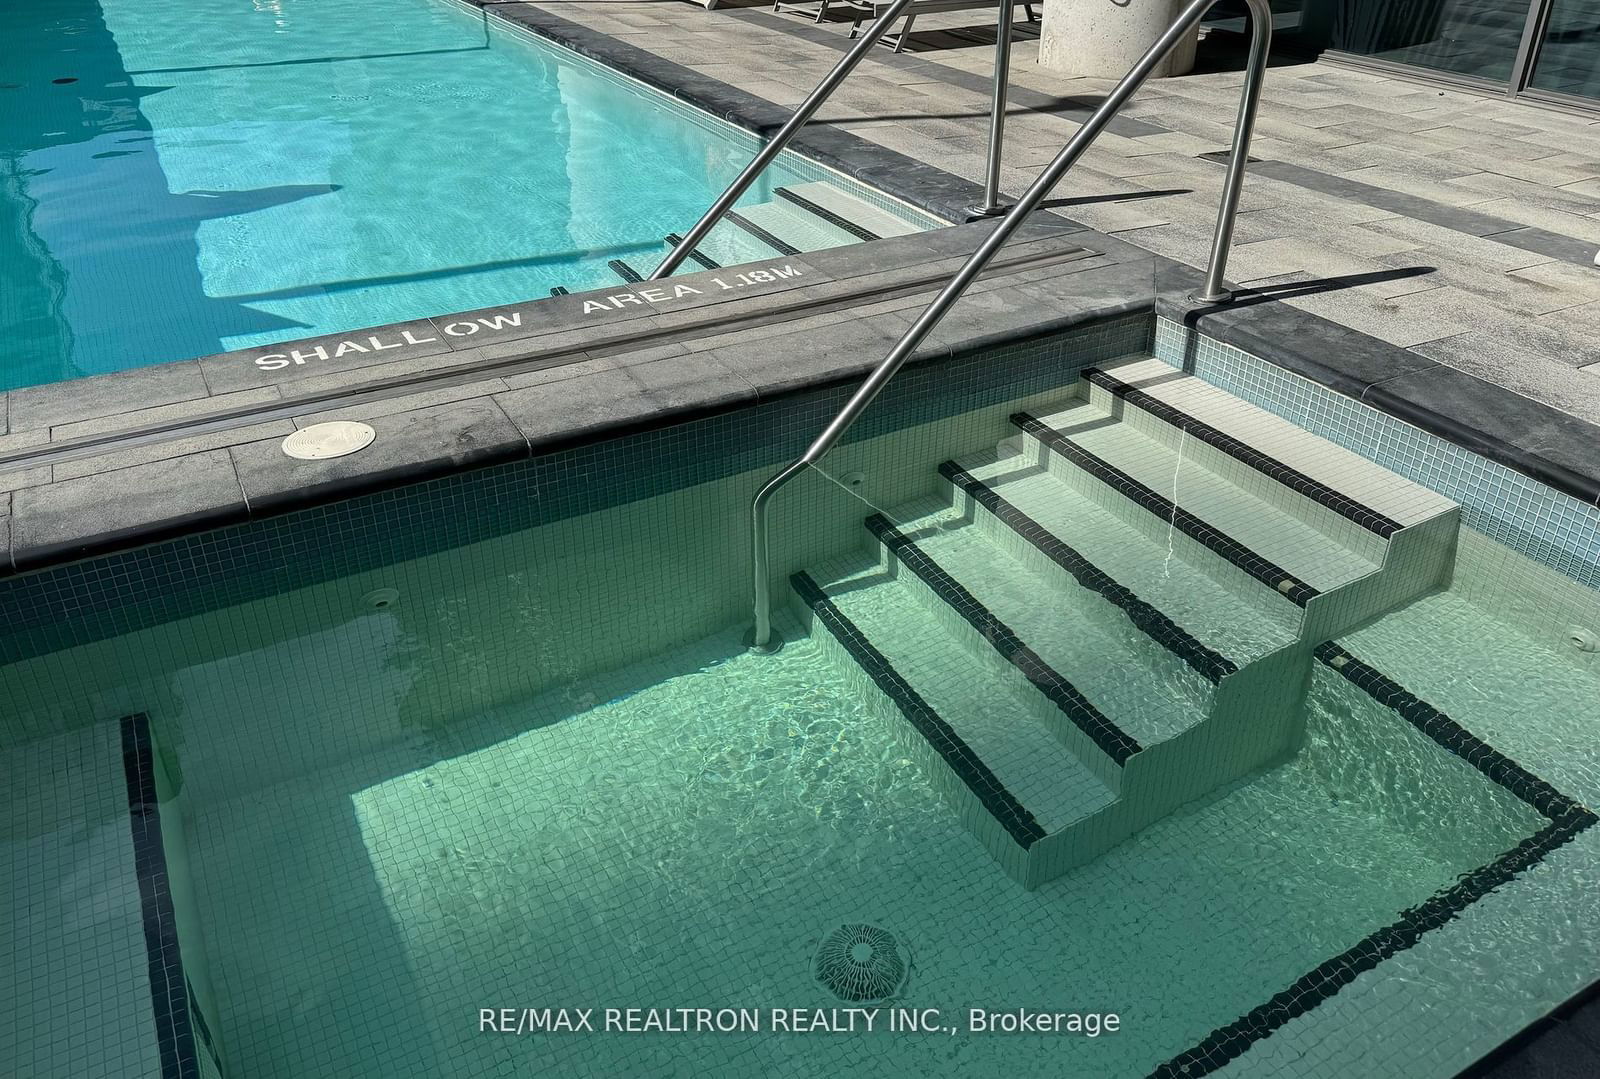
Luxury "The Bond" condo in the Heart Of Entertainment District. Beautiful 1 bed+ Den with unobstructed East City View, 9' Ceiling, 116 Sg feet Balcony, Floor to ceiling windows. Excellent location: Walking distance to Subway & TTC, Financial District, Park, CN Tower, U of T, Roy Thompson Hall, Shopping, Restaurants, Bars and Theatres. Luxurious Amenities: Outdoor Pool, Hot Tub, Fitness Room, Yoga Room, Party Room, Billiards Room, outdoor Lounge with Bbq.
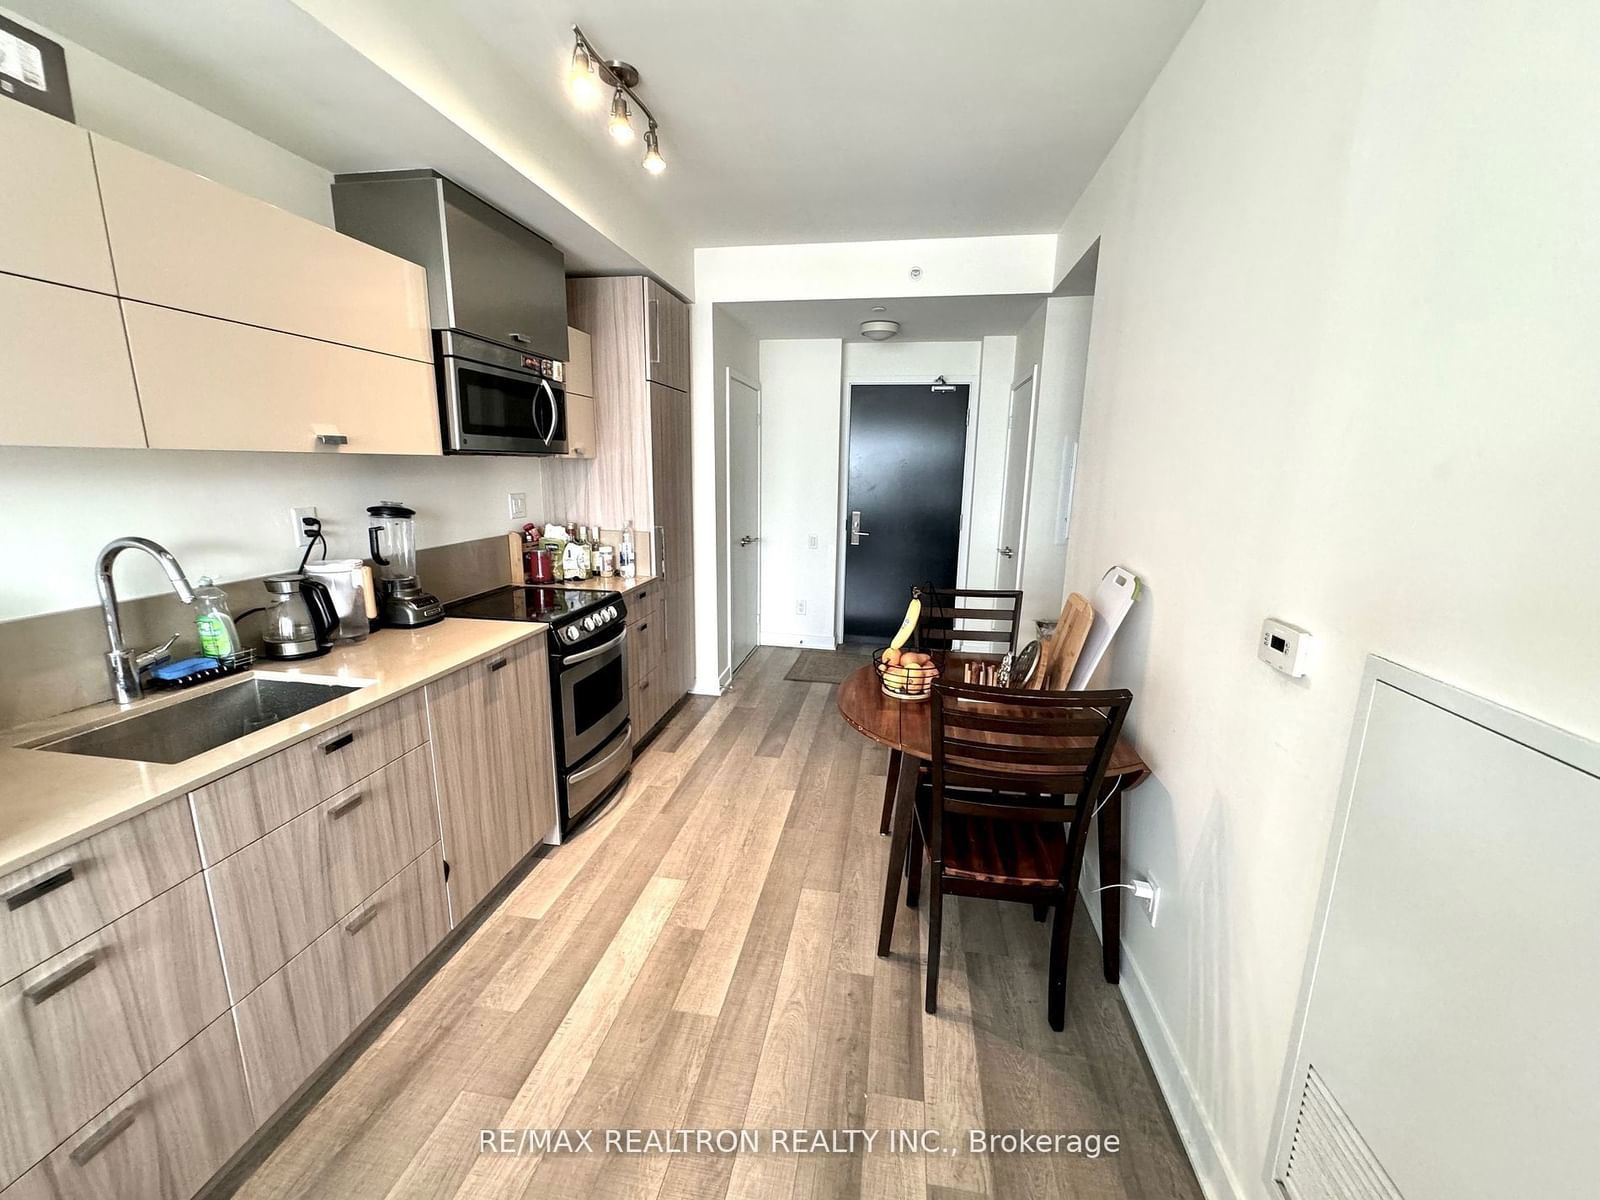
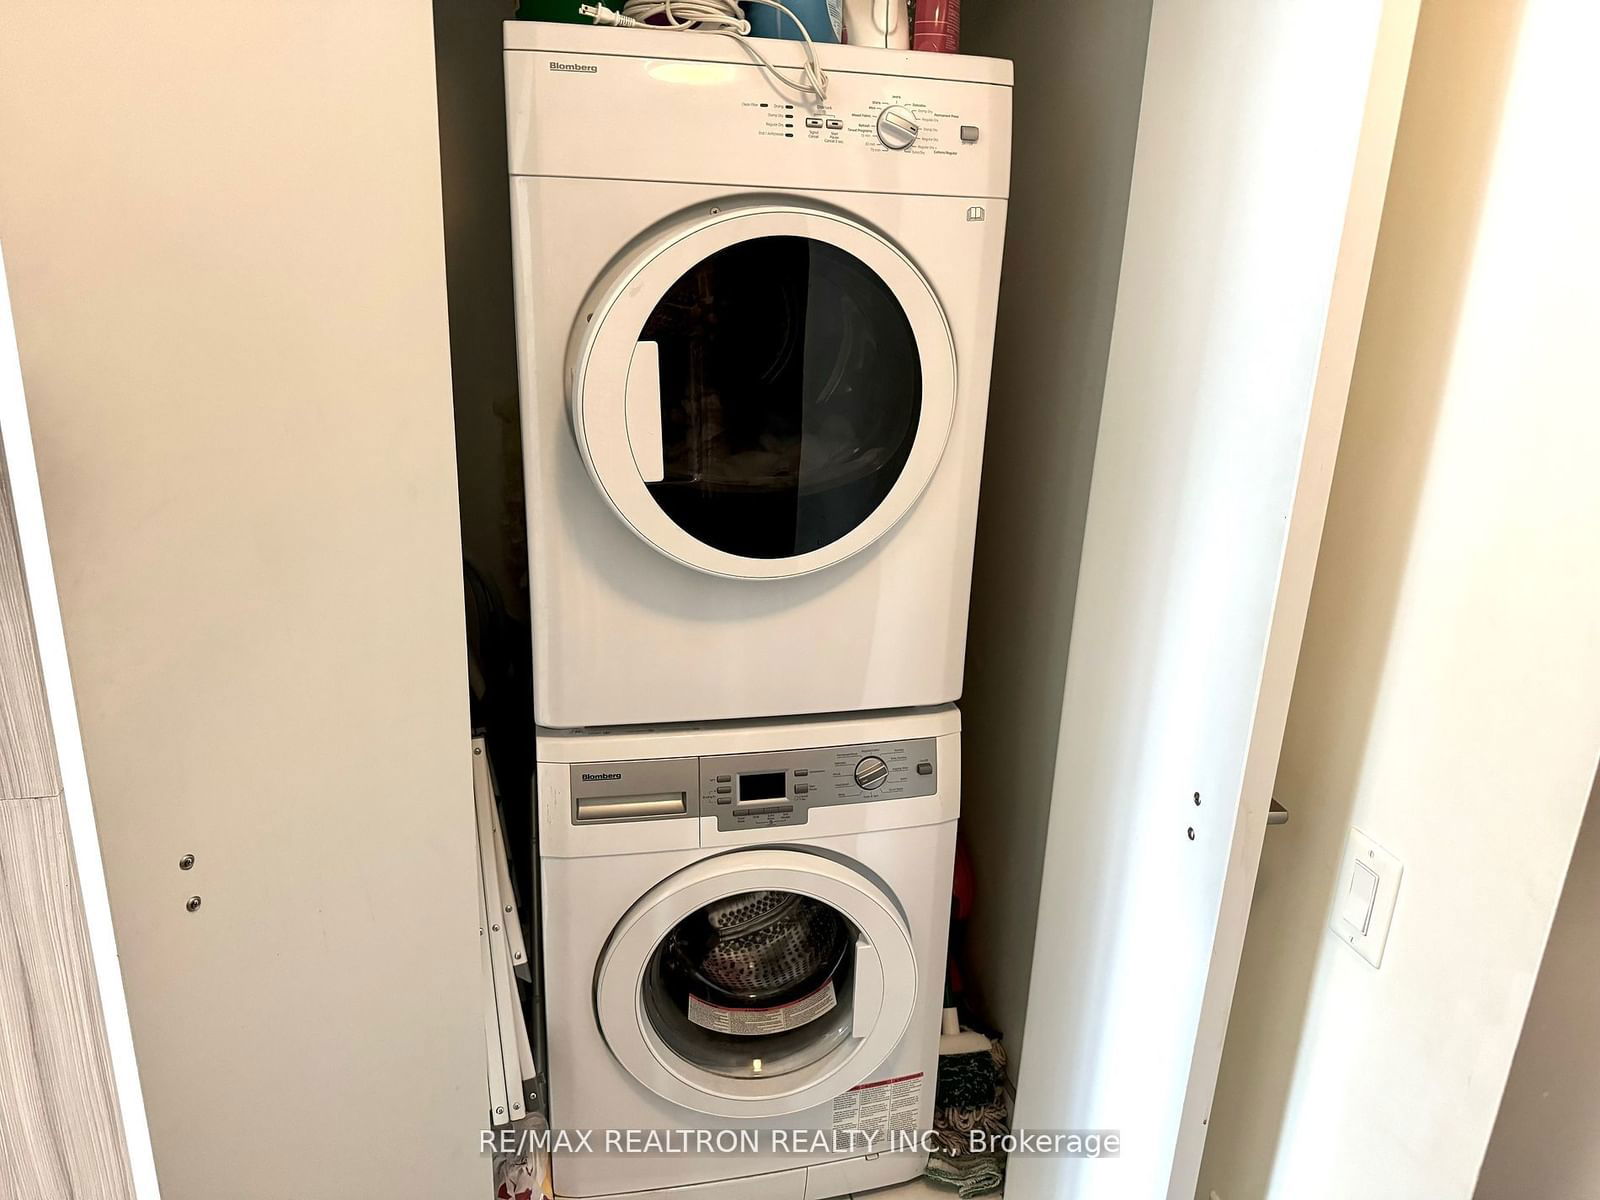
ExtrasEuropean-Stile Kitchen Appliances: Fully integrated Fridge & Dishwasher, Stainless Steel Stove &B/I Microwave with integrated Exhaust Fan, Stacked Washer & Dryer, All Electric Light Fixtures, All Window coverings,1 locker.
re/max realtron realty inc.MLS® #C9357553
Amenities
Explore Neighbourhood
Similar Listings
Demographics
Based on the dissemination area as defined by Statistics Canada. A dissemination area contains, on average, approximately 200 – 400 households.
Price Trends
Maintenance Fees
Building Trends At The Bond Condos
Days on Strata
List vs Selling Price
Offer Competition
Turnover of Units
Property Value
Price Ranking
Sold Units
Rented Units
Best Value Rank
Appreciation Rank
Rental Yield
High Demand
Transaction Insights at 290 Adelaide Street W
| Studio | 1 Bed | 1 Bed + Den | 2 Bed | 2 Bed + Den | 3 Bed | 3 Bed + Den | |
|---|---|---|---|---|---|---|---|
| Price Range | No Data | $520,000 - $559,900 | $615,000 - $758,000 | $742,000 - $880,000 | $975,000 | No Data | No Data |
| Avg. Cost Per Sqft | No Data | $1,297 | $1,215 | $1,124 | $1,100 | No Data | No Data |
| Price Range | $2,000 - $2,200 | $2,200 - $2,650 | $2,450 - $3,300 | $2,800 - $4,200 | $3,950 | $4,000 | No Data |
| Avg. Wait for Unit Availability | 140 Days | 55 Days | 57 Days | 54 Days | 344 Days | No Data | No Data |
| Avg. Wait for Unit Availability | 36 Days | 11 Days | 19 Days | 16 Days | 218 Days | 514 Days | No Data |
| Ratio of Units in Building | 9% | 35% | 23% | 30% | 4% | 2% | 1% |
Transactions vs Inventory
Total number of units listed and sold in Queen West

