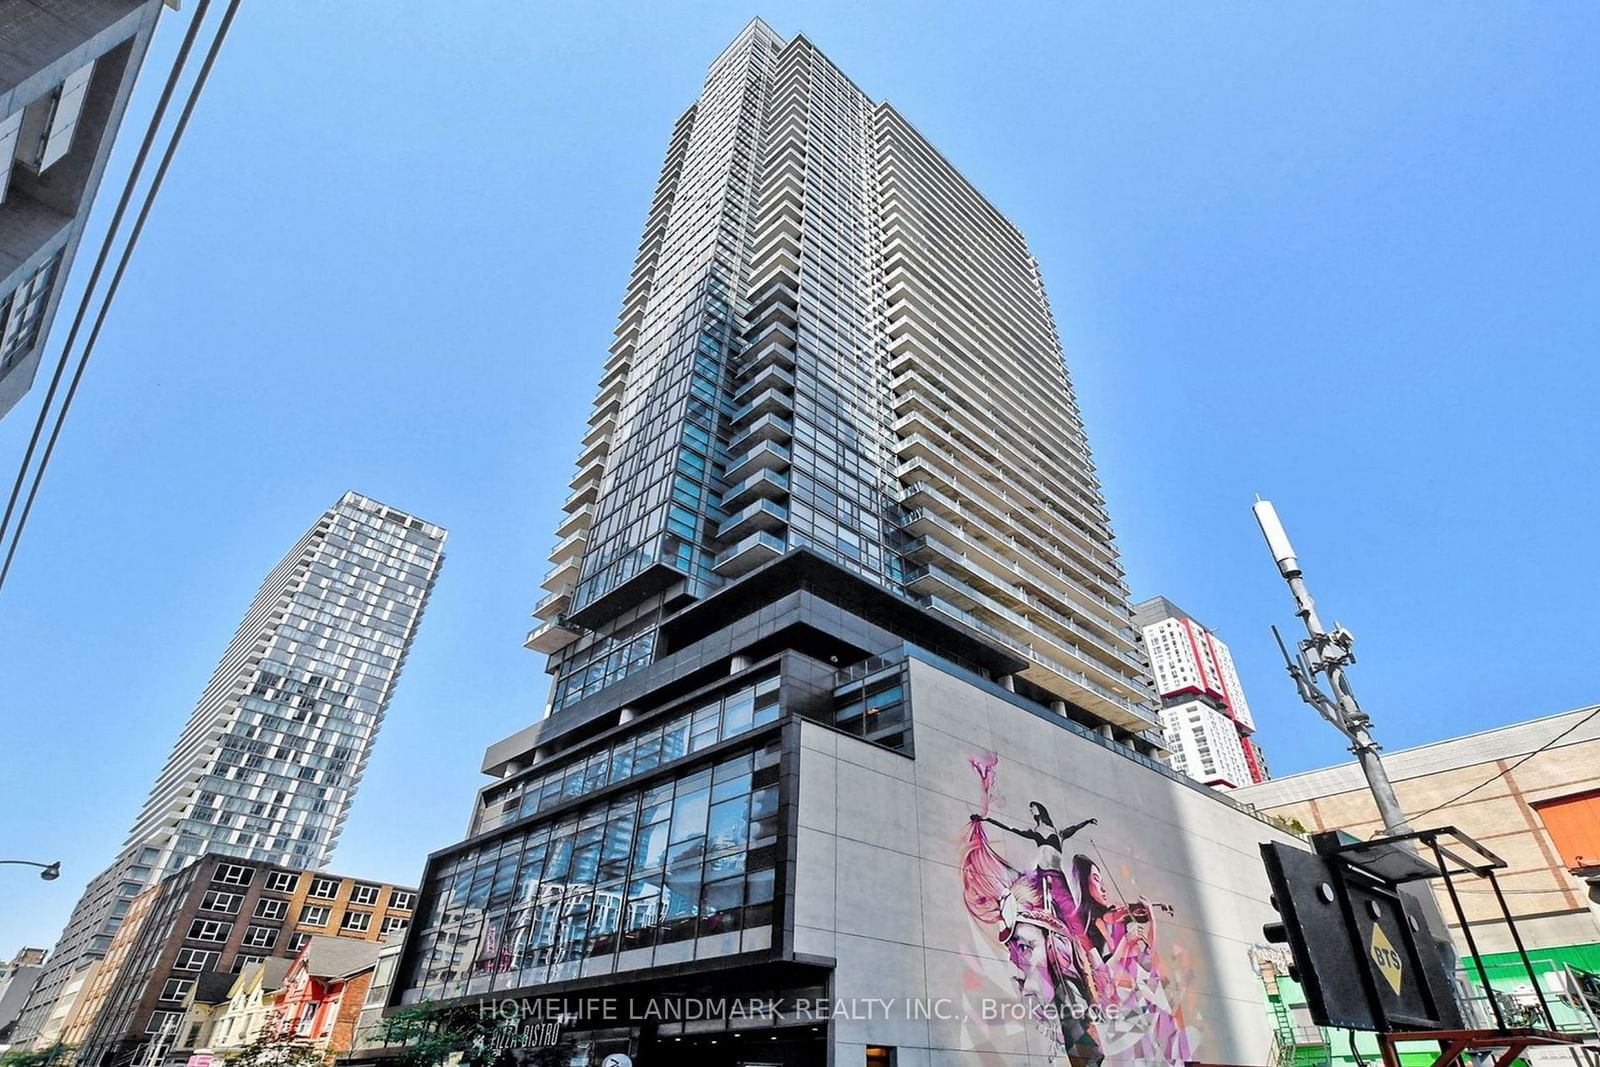
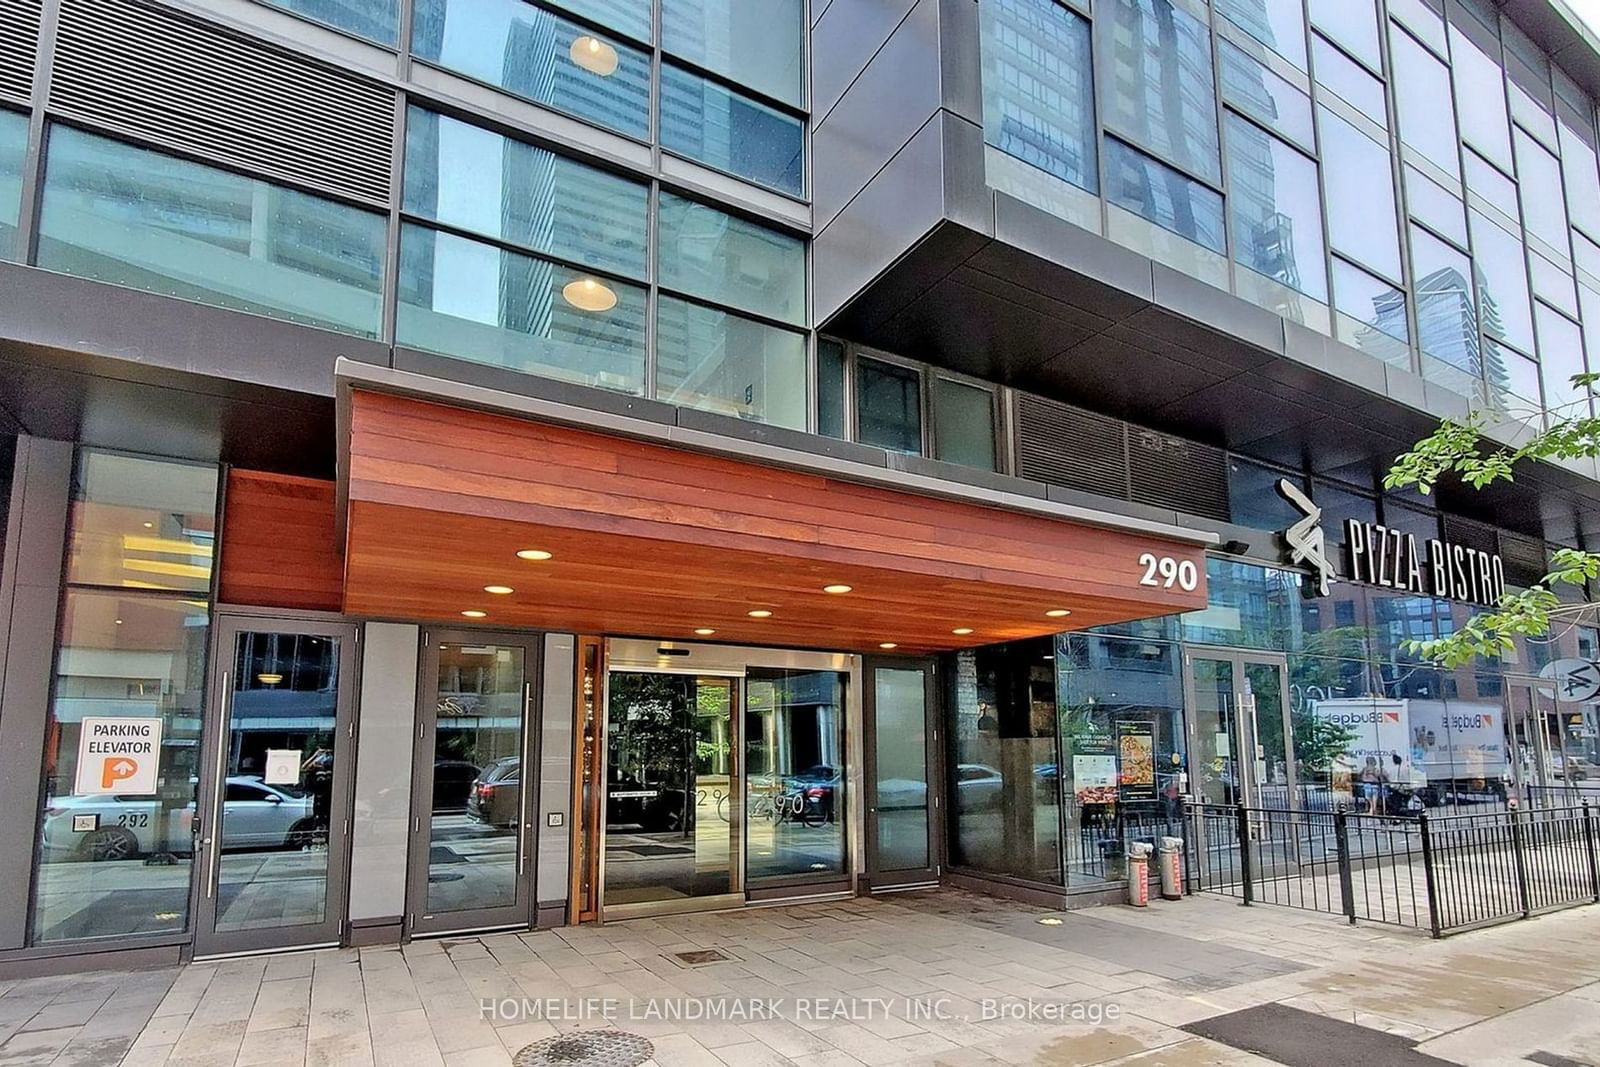
2911 - 290 Adelaide St W
Listing History
Unit Highlights
Maintenance Fees
Utility Type
- Air Conditioning
- Central Air
- Heat Source
- Gas
- Heating
- Forced Air
Room Dimensions
About this Listing
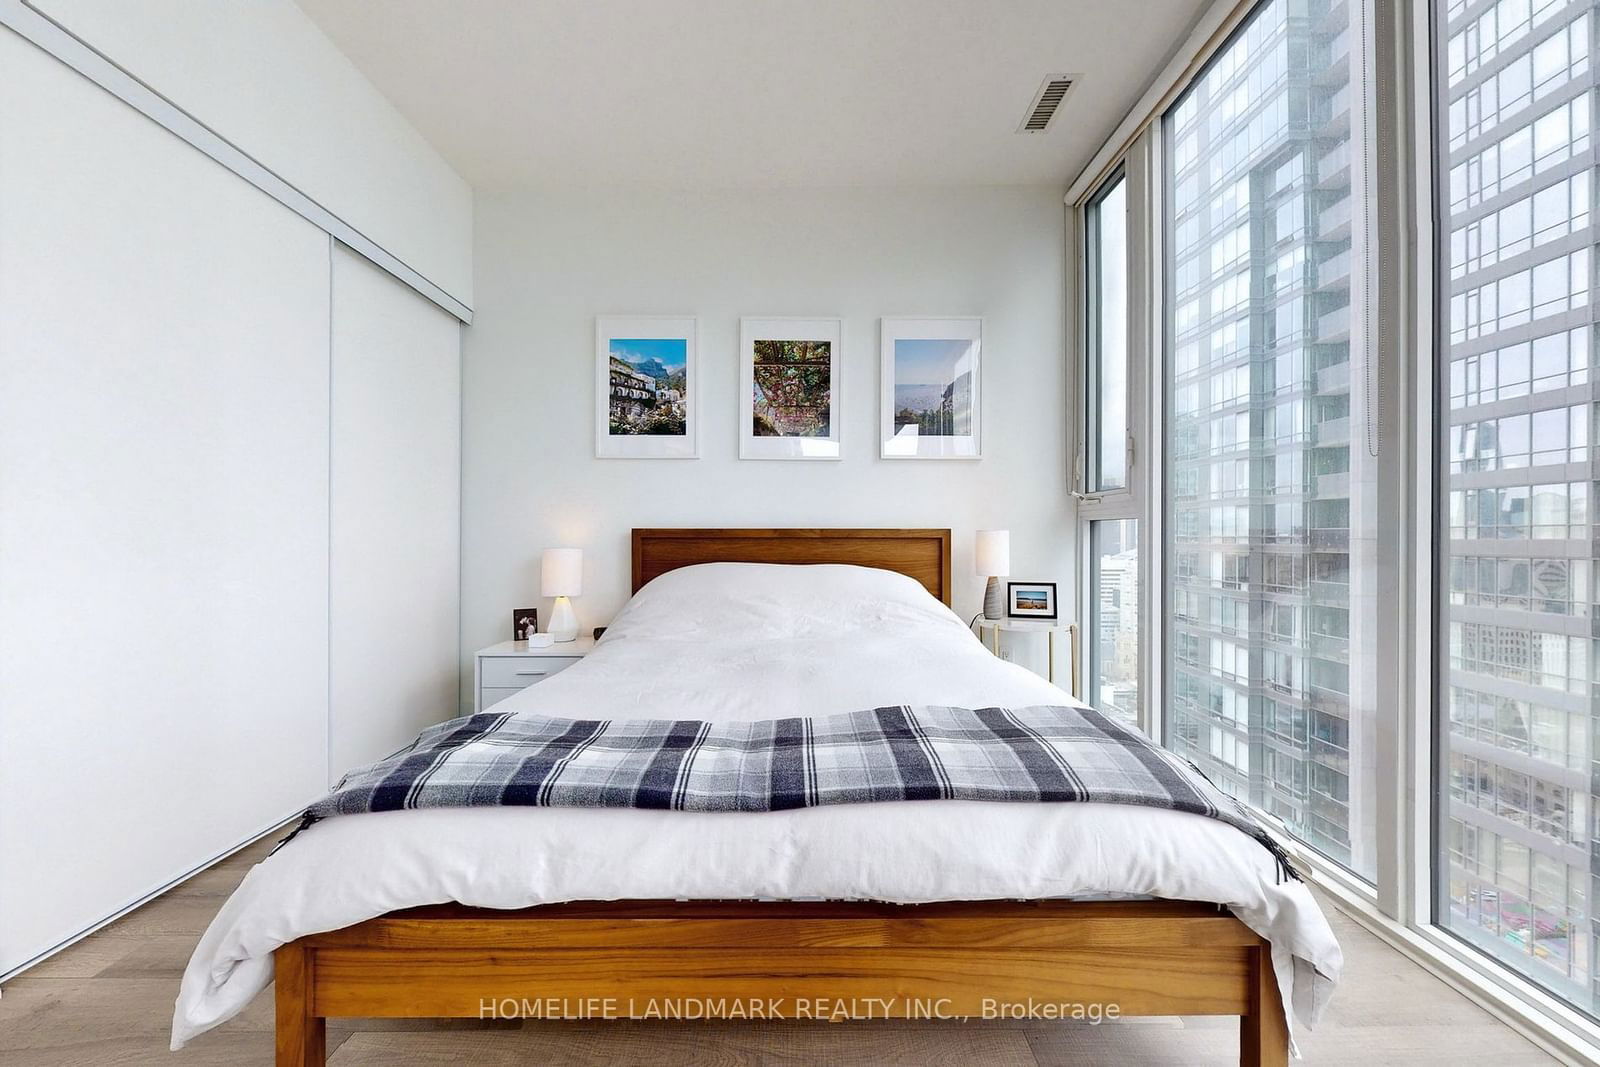
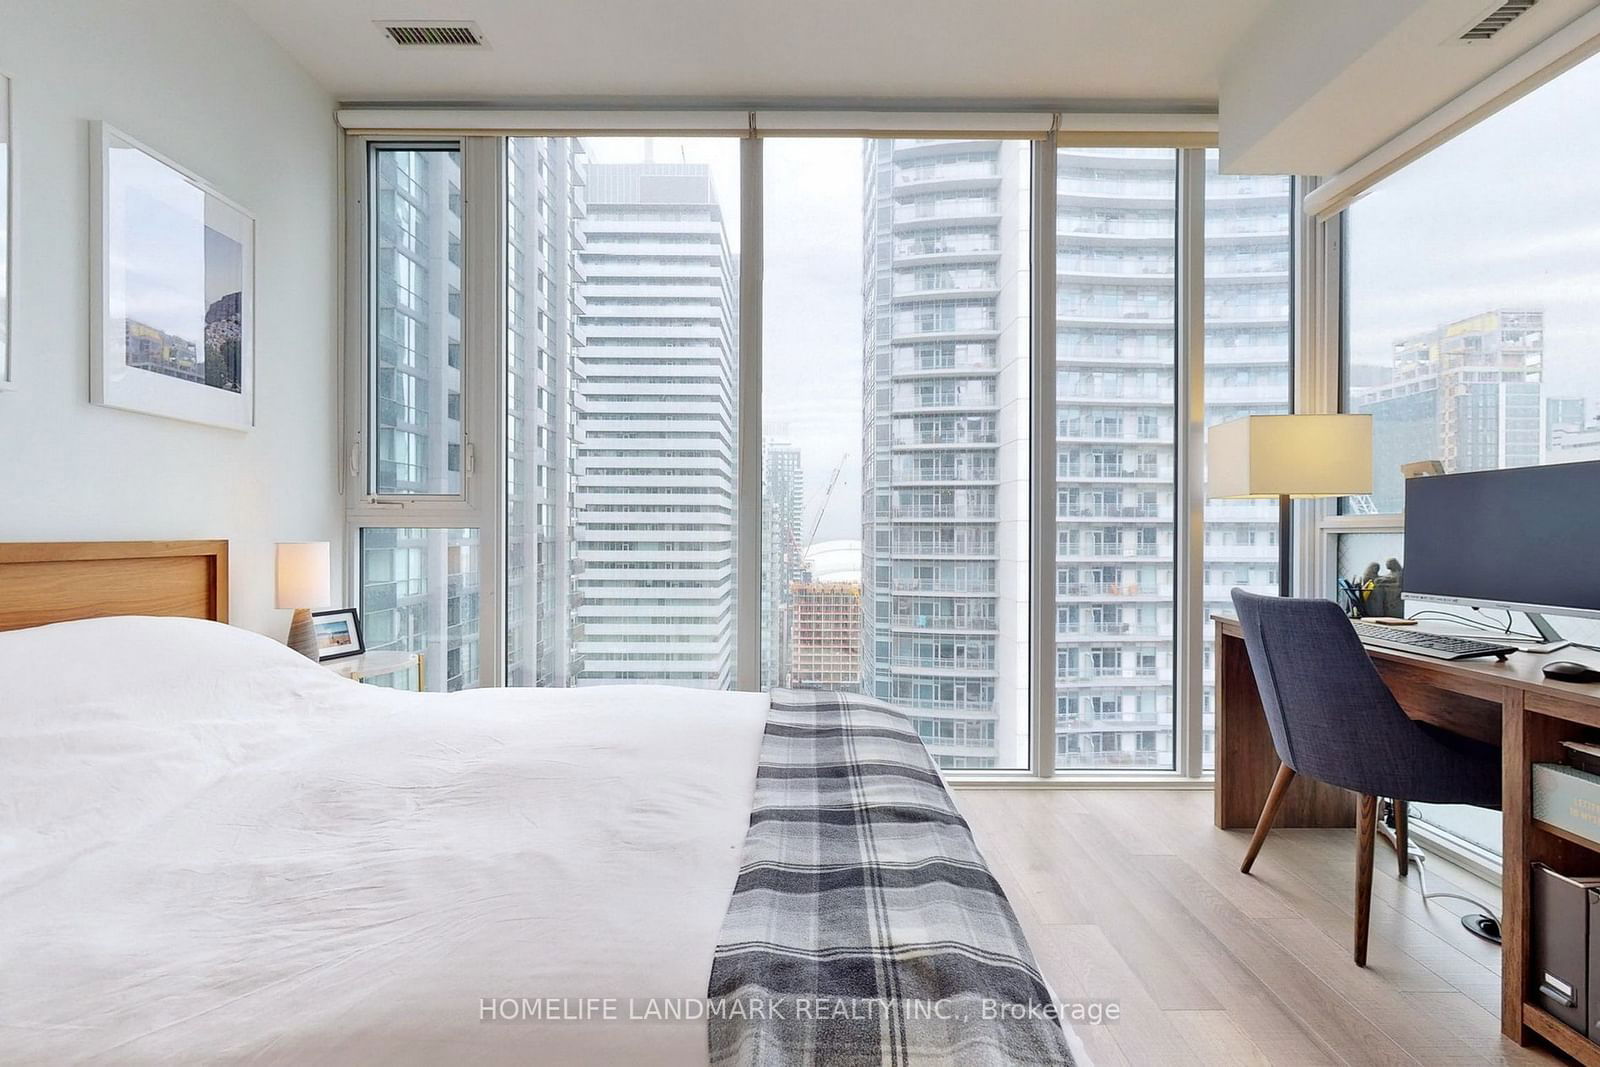
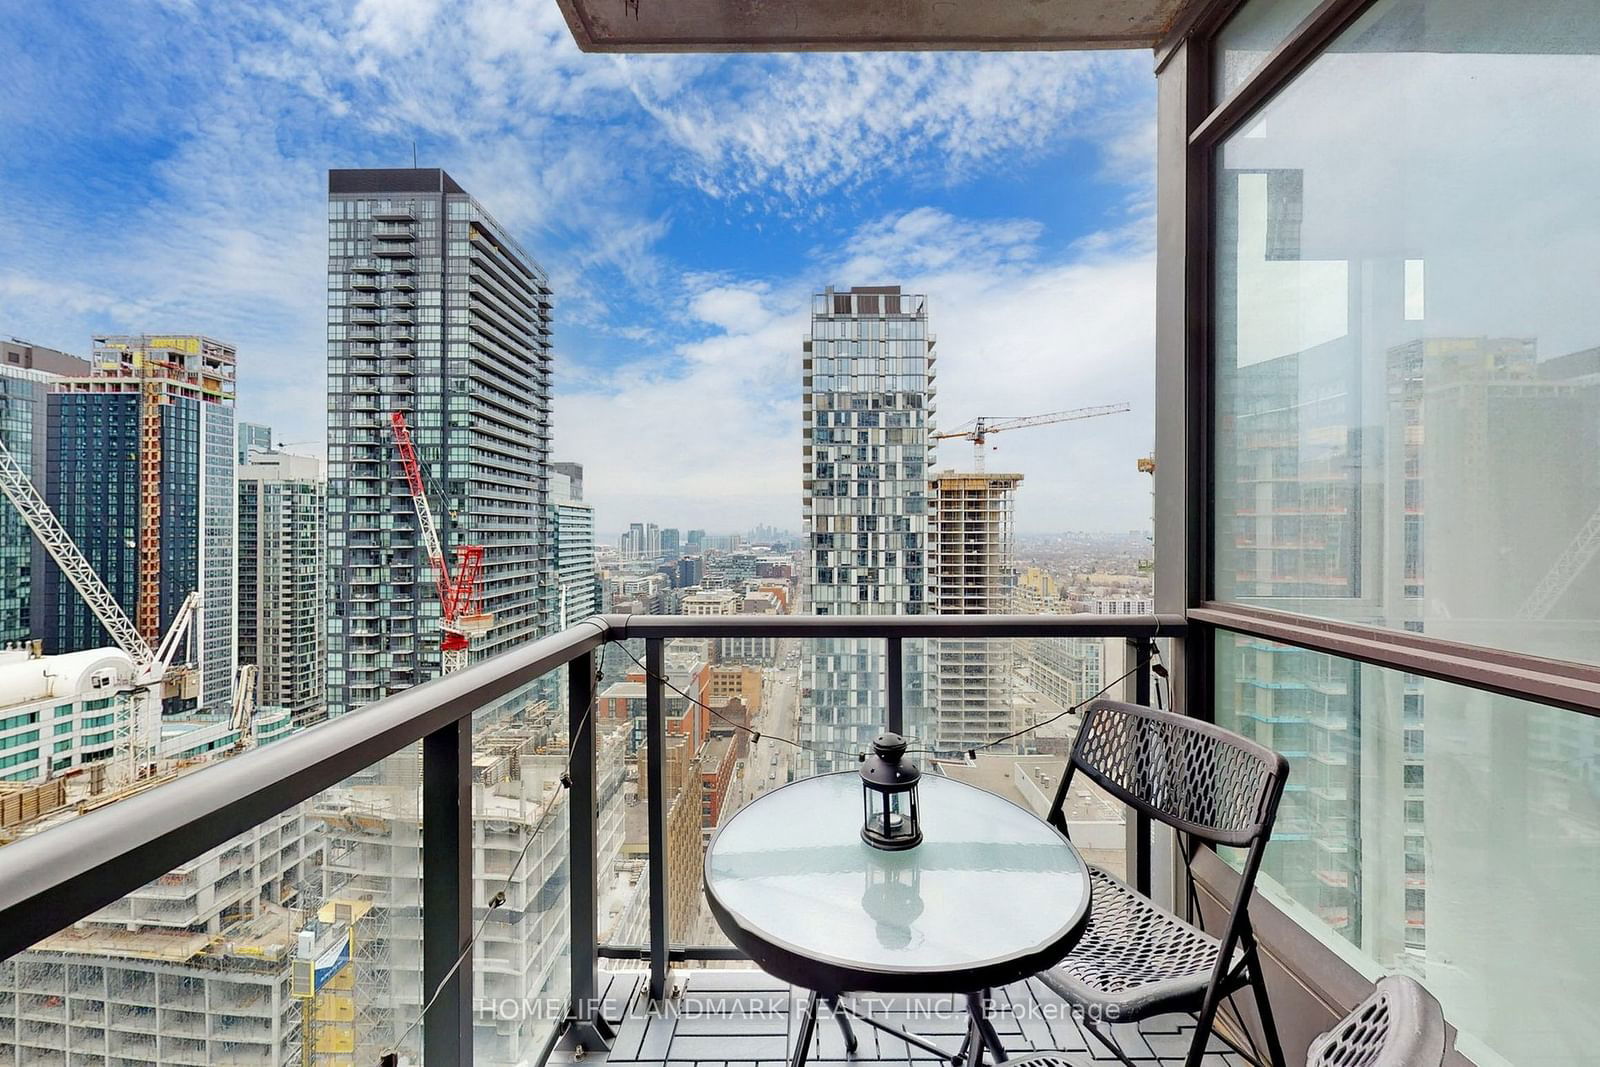
Look no further! Rarely Find Luxury South/West Corner 1+Den Suite On Preimium High Floor W/Wrap Around Floor To Ceiling Windows, Full Of Sunlights & Incredible City Views. Sleek & Modern Kitchen W/Integrated Appliances, The Largest Sized 1+Den Suite In The Building. 9 Ft Ceilings, One Of The Best Layout W/Den As a Seperate Rm. Very Spacious and Bright Living Area. Steps To Tiff, Financial District, Rogers Centre, Ttc Subways, Underground Path Concourse! Close to U.of T. and OCAD. 100 Walk & Transit Score. Unbeatable Value at Toronto's Most Sought-After Live/Work/Entertainment Hub!
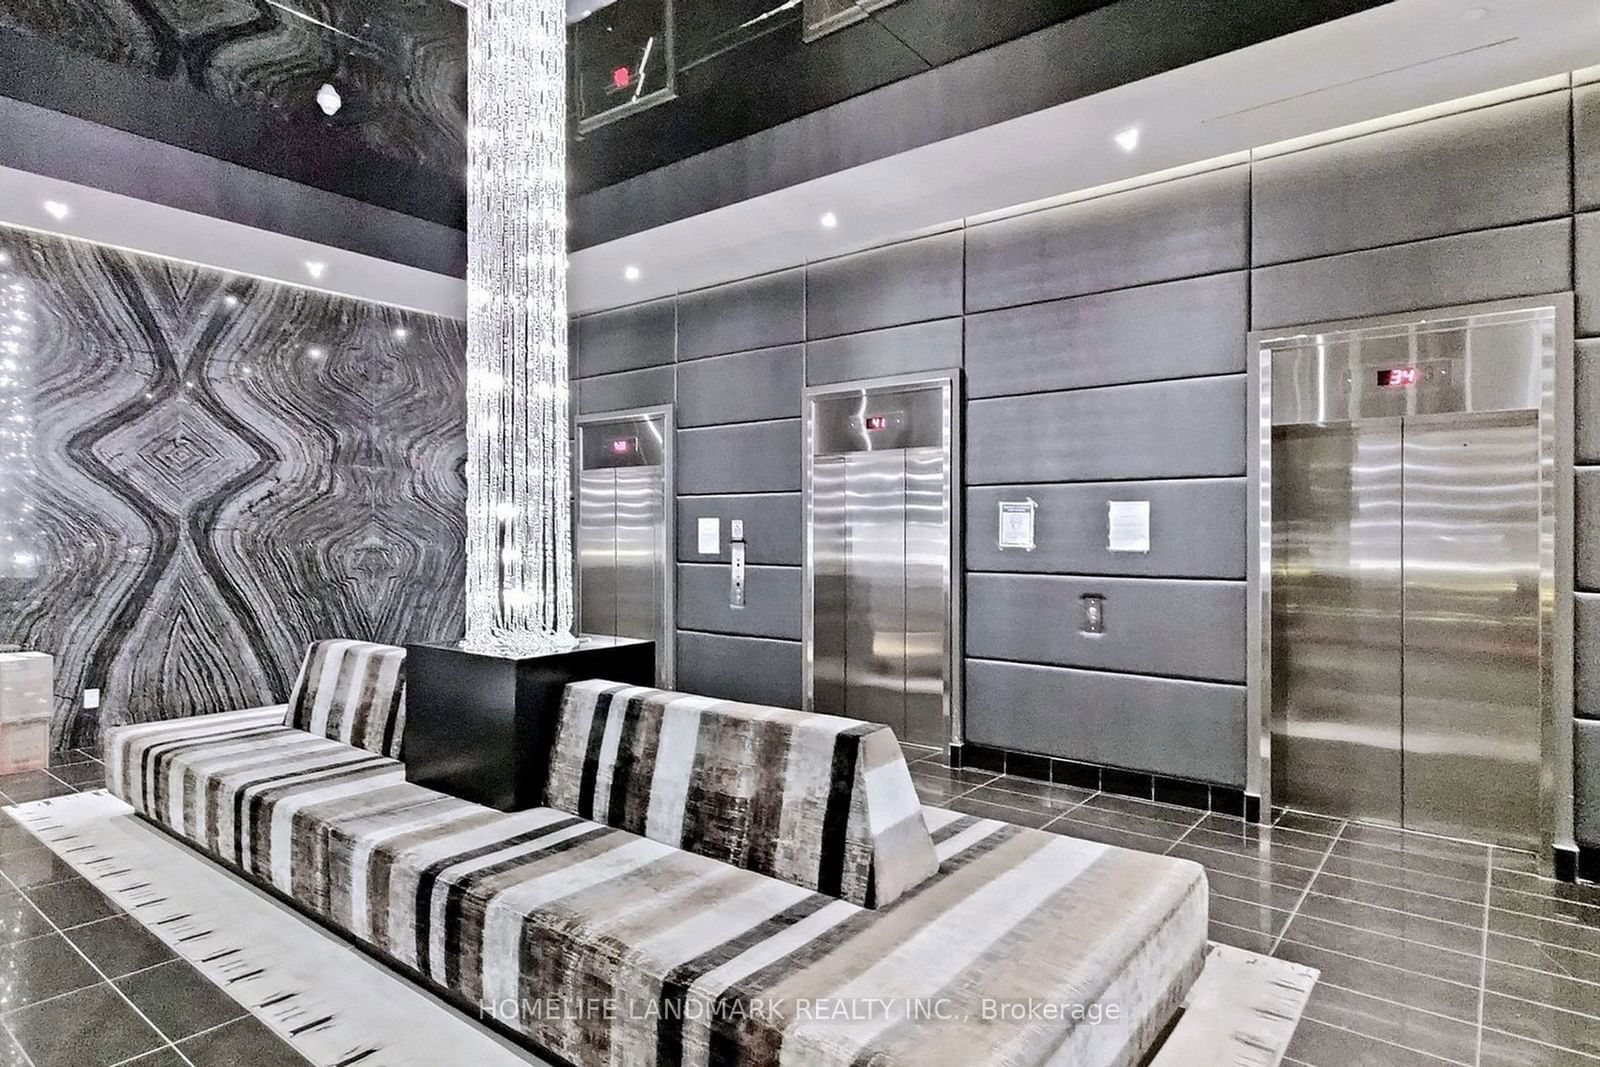
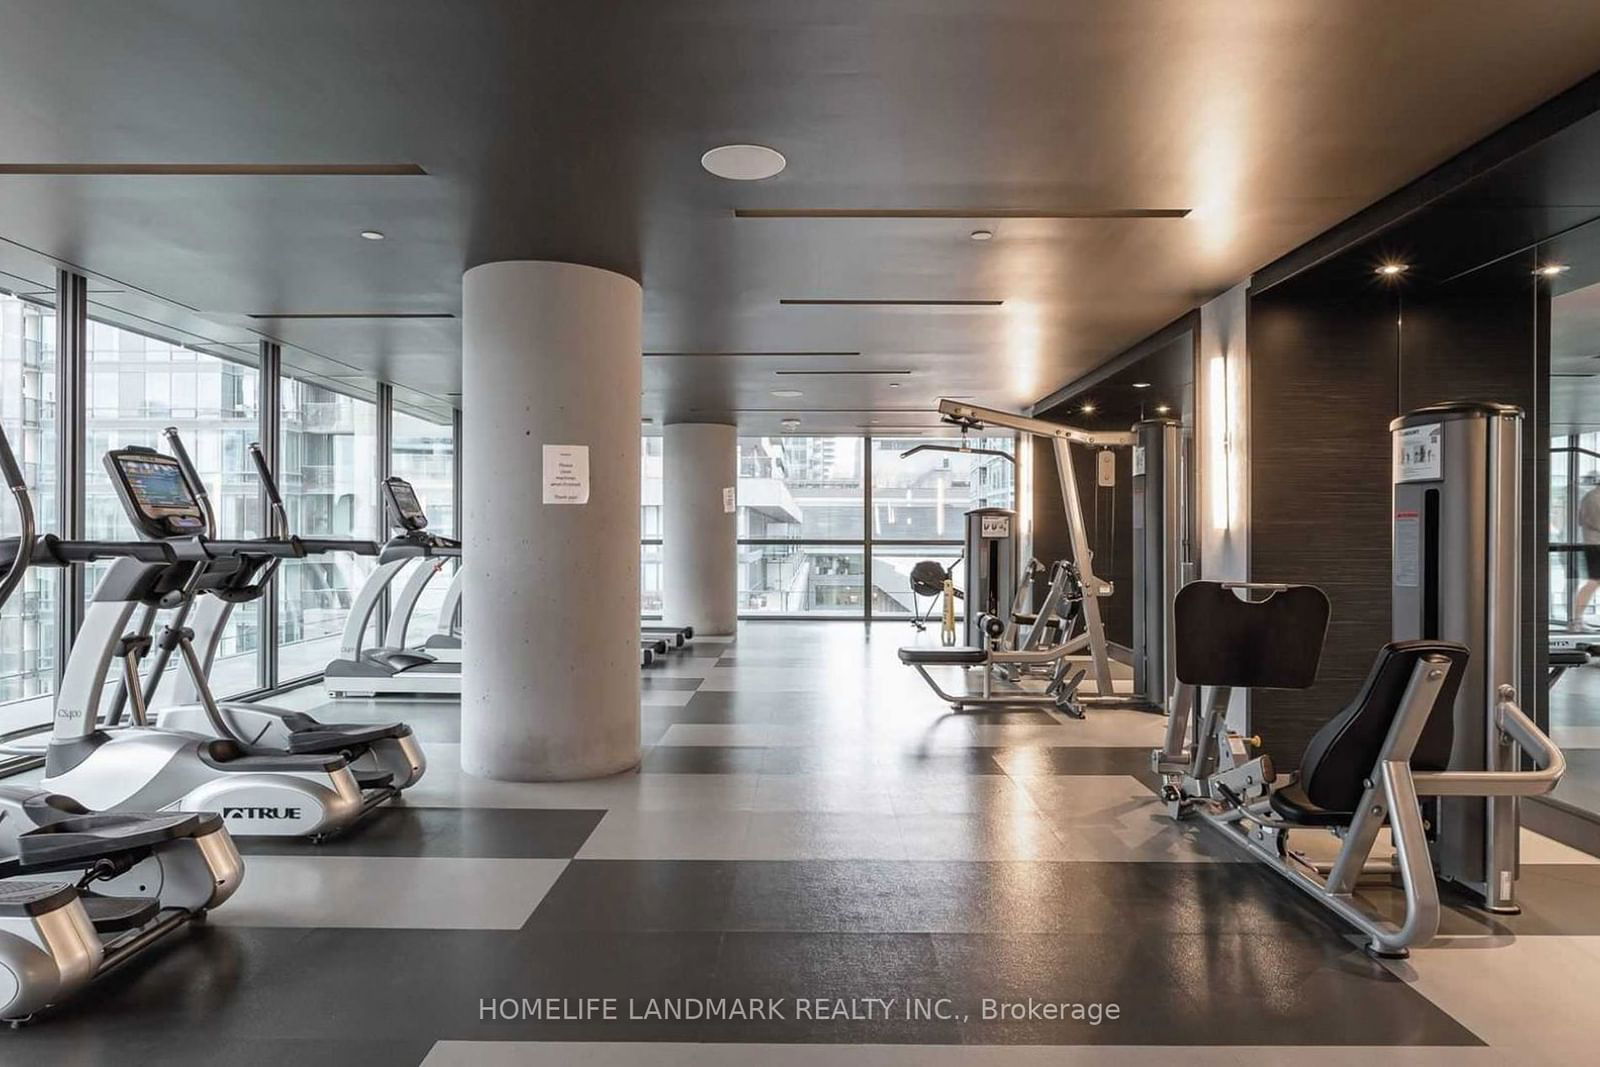
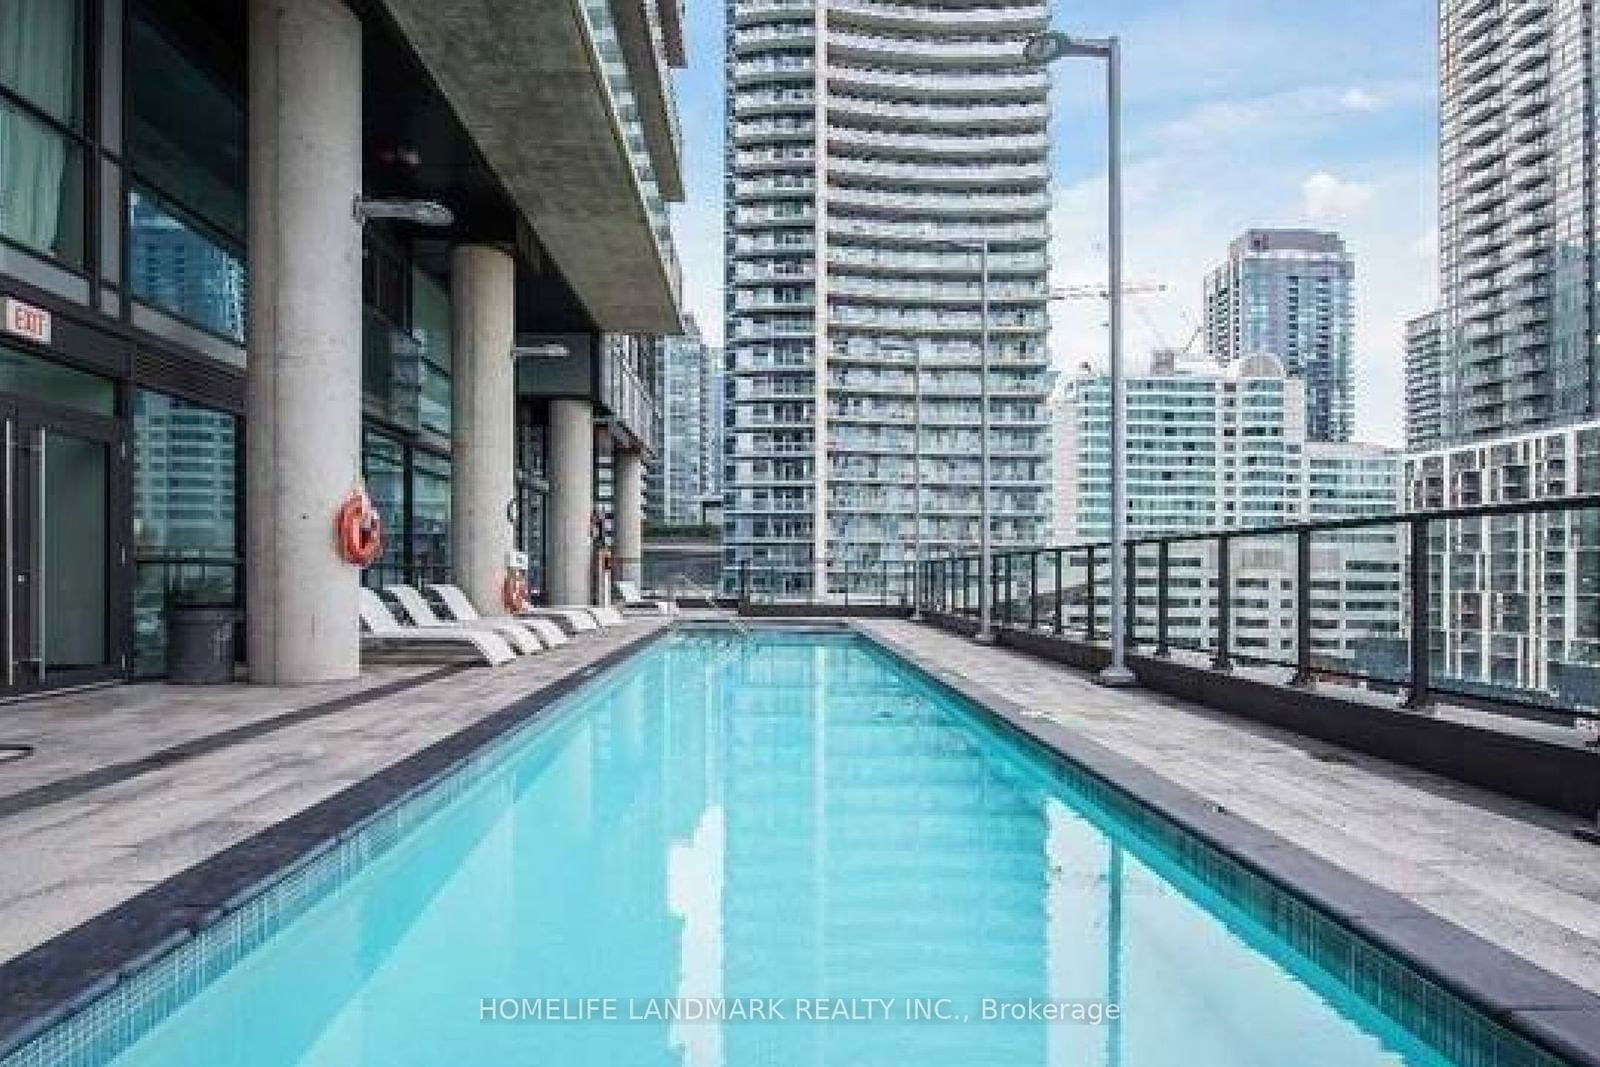
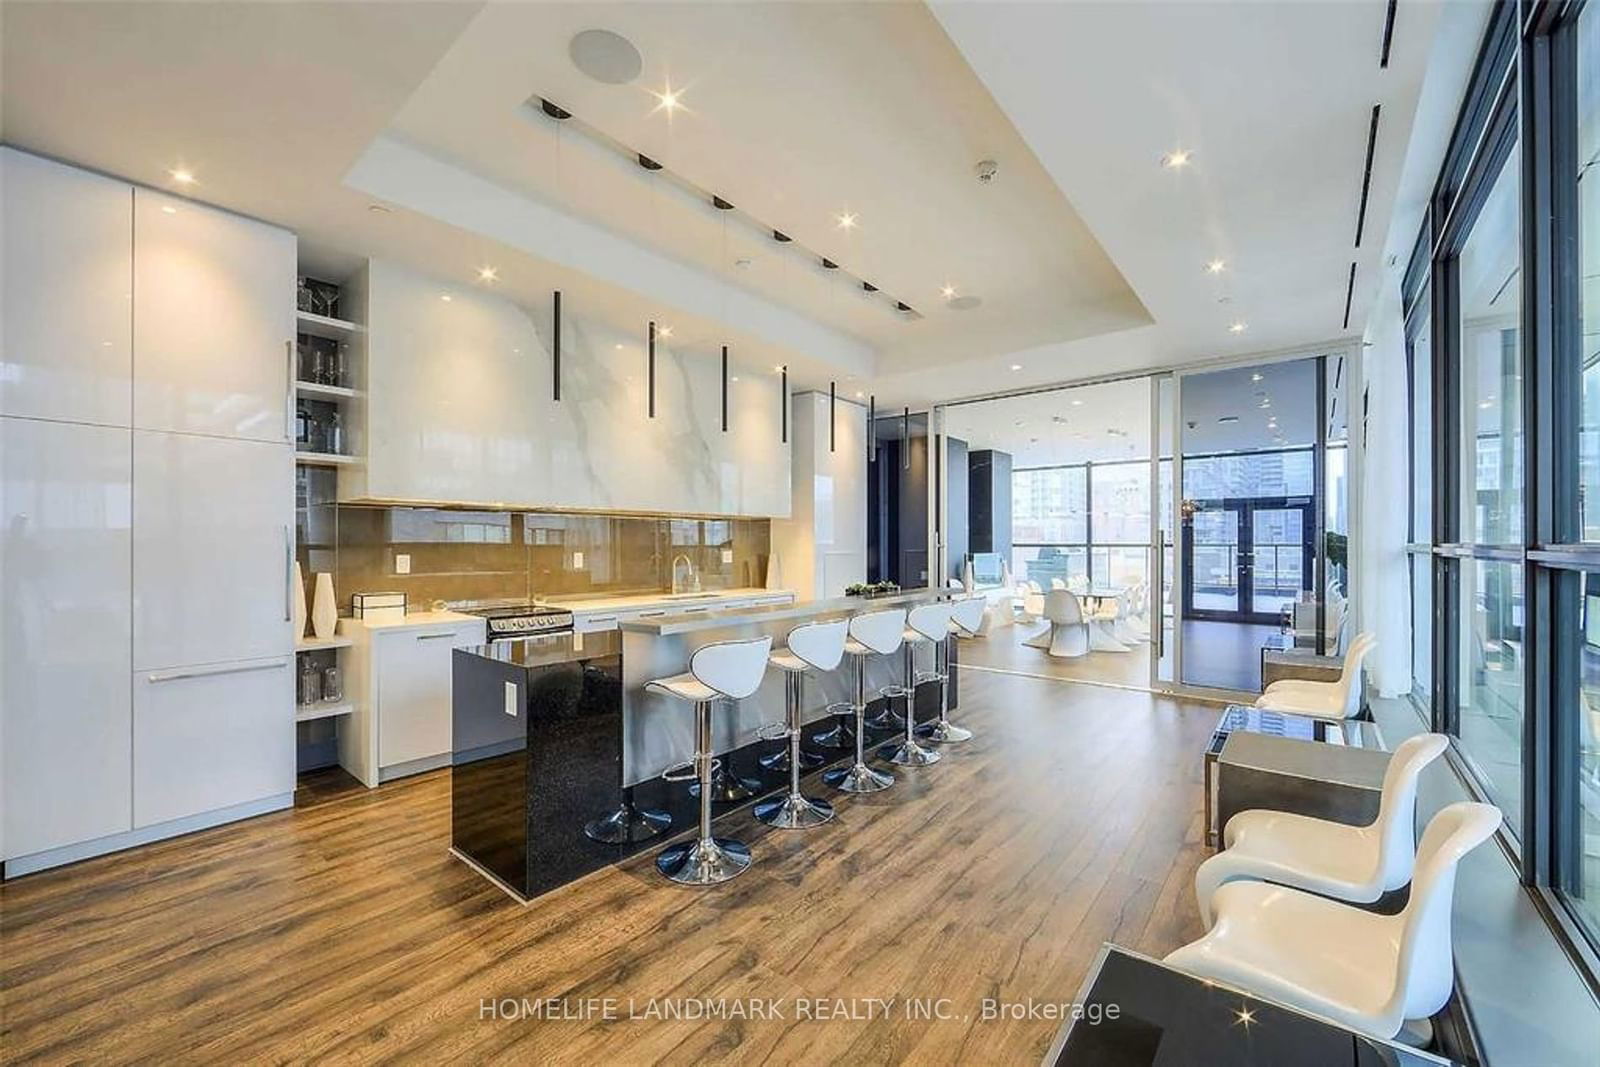
ExtrasB/I Fridge, Stove, Dishwasher, Microwave, Washer/Dryer, All Elf & Window Coverings. New Paintings. Amazing Amenities: Gym, Outdoor Pool & Bbq Area, Billards Room, Party Room,Golf Simulator, Tanning Deck, Visitor Parking,Sauna, Guest Suites.
homelife landmark realty inc.MLS® #C9362507
Amenities
Explore Neighbourhood
Similar Listings
Demographics
Based on the dissemination area as defined by Statistics Canada. A dissemination area contains, on average, approximately 200 – 400 households.
Price Trends
Maintenance Fees
Building Trends At The Bond Condos
Days on Strata
List vs Selling Price
Offer Competition
Turnover of Units
Property Value
Price Ranking
Sold Units
Rented Units
Best Value Rank
Appreciation Rank
Rental Yield
High Demand
Transaction Insights at 290 Adelaide Street W
| Studio | 1 Bed | 1 Bed + Den | 2 Bed | 2 Bed + Den | 3 Bed | 3 Bed + Den | |
|---|---|---|---|---|---|---|---|
| Price Range | No Data | $520,000 - $559,900 | $615,000 - $758,000 | $742,000 - $880,000 | $975,000 | No Data | No Data |
| Avg. Cost Per Sqft | No Data | $1,297 | $1,215 | $1,124 | $1,100 | No Data | No Data |
| Price Range | $2,000 - $2,200 | $2,200 - $2,650 | $2,450 - $3,300 | $2,800 - $4,200 | $3,950 | $4,000 | No Data |
| Avg. Wait for Unit Availability | 140 Days | 55 Days | 57 Days | 54 Days | 344 Days | No Data | No Data |
| Avg. Wait for Unit Availability | 36 Days | 11 Days | 19 Days | 16 Days | 218 Days | 514 Days | No Data |
| Ratio of Units in Building | 9% | 35% | 23% | 30% | 4% | 2% | 1% |
Transactions vs Inventory
Total number of units listed and sold in Queen West
