Listing History
Unit Highlights
Utilities Included
Utility Type
- Air Conditioning
- Central Air
- Heat Source
- Gas
- Heating
- Forced Air
Room Dimensions
About this Listing
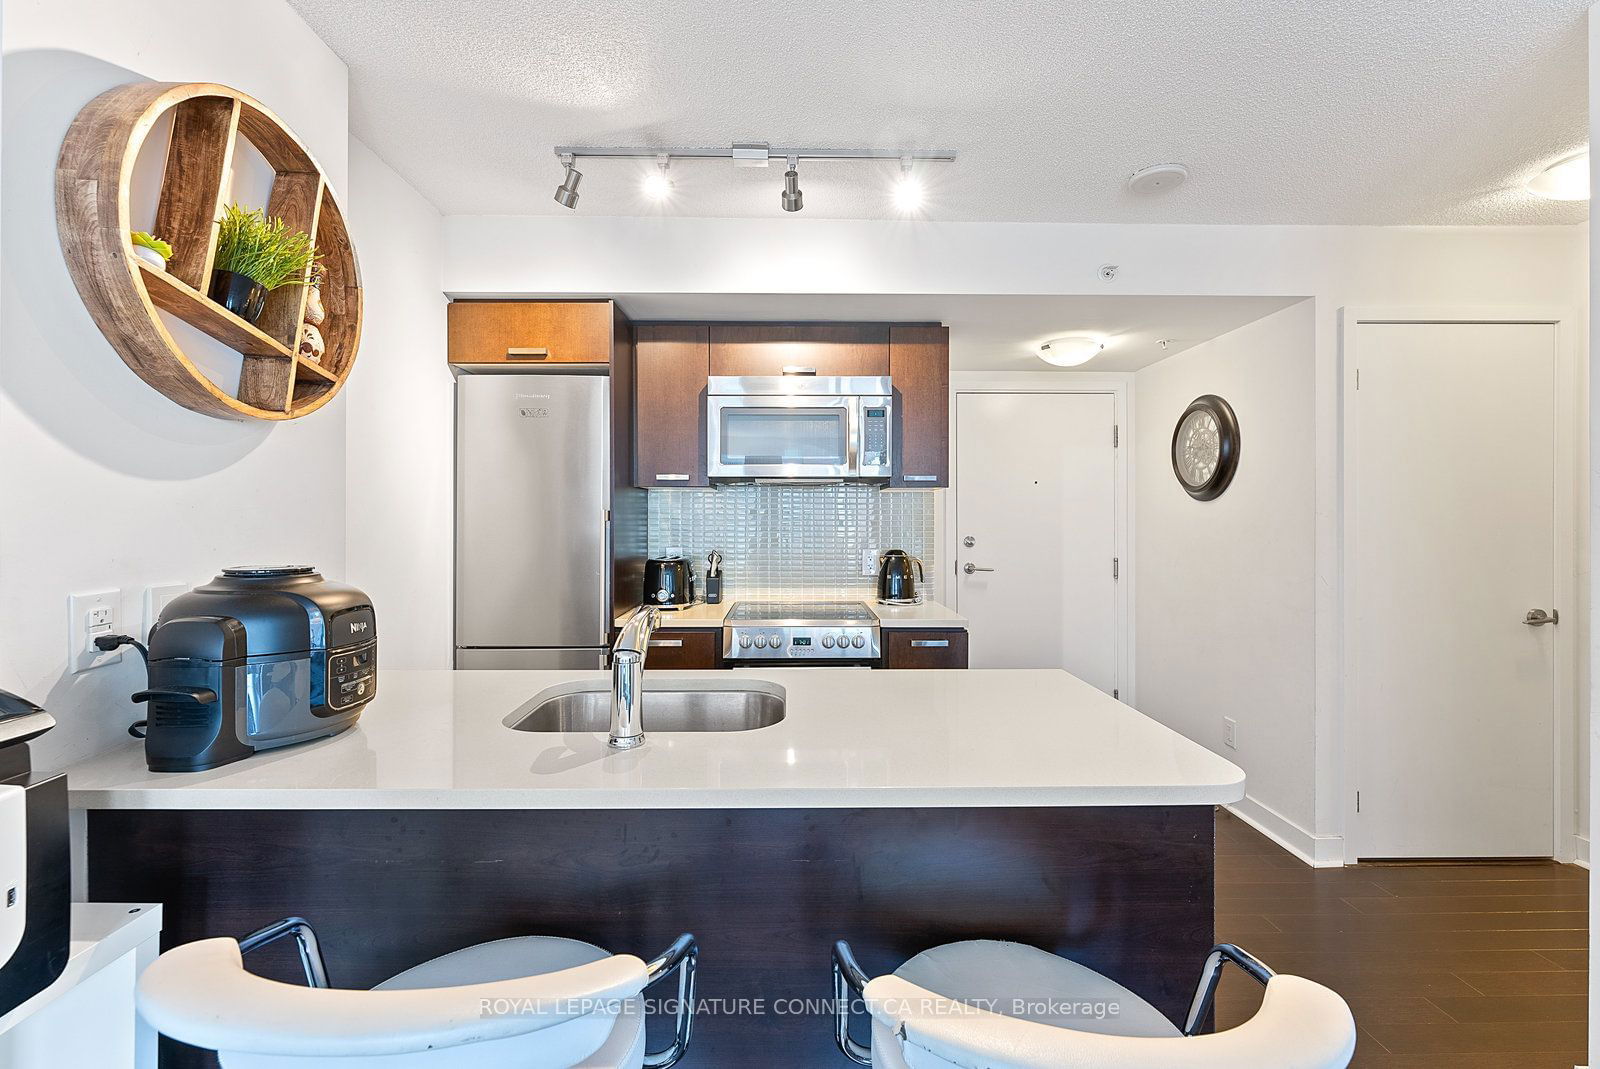
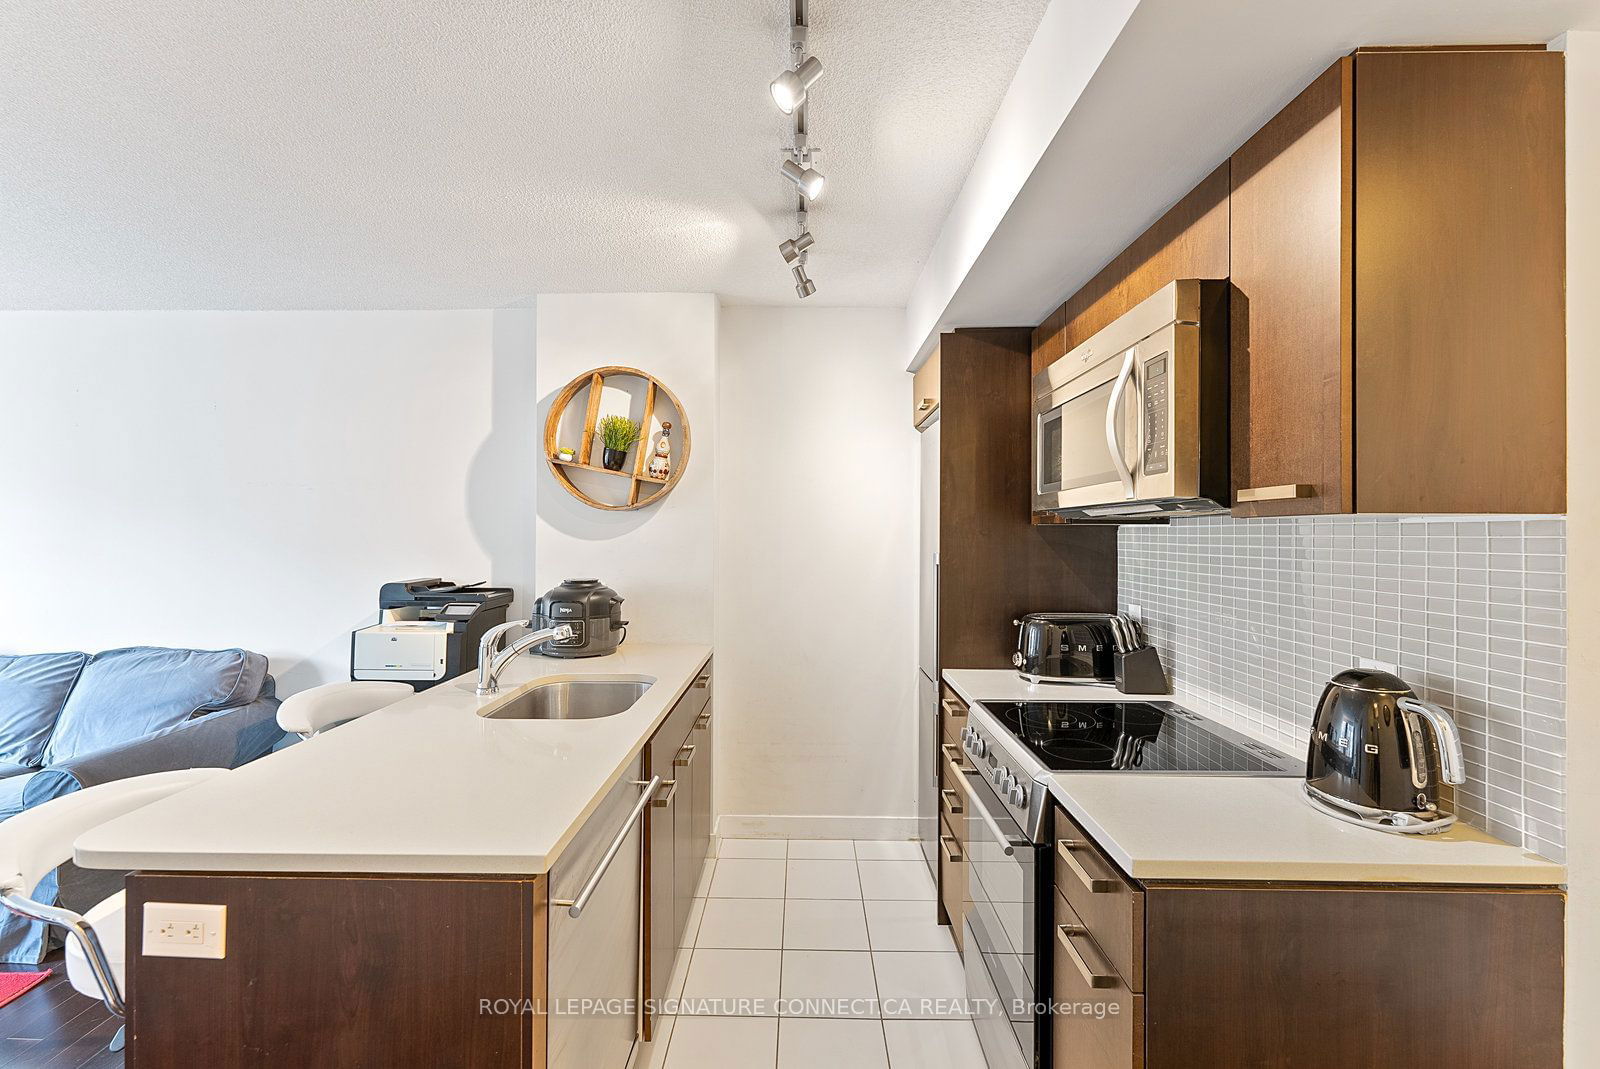
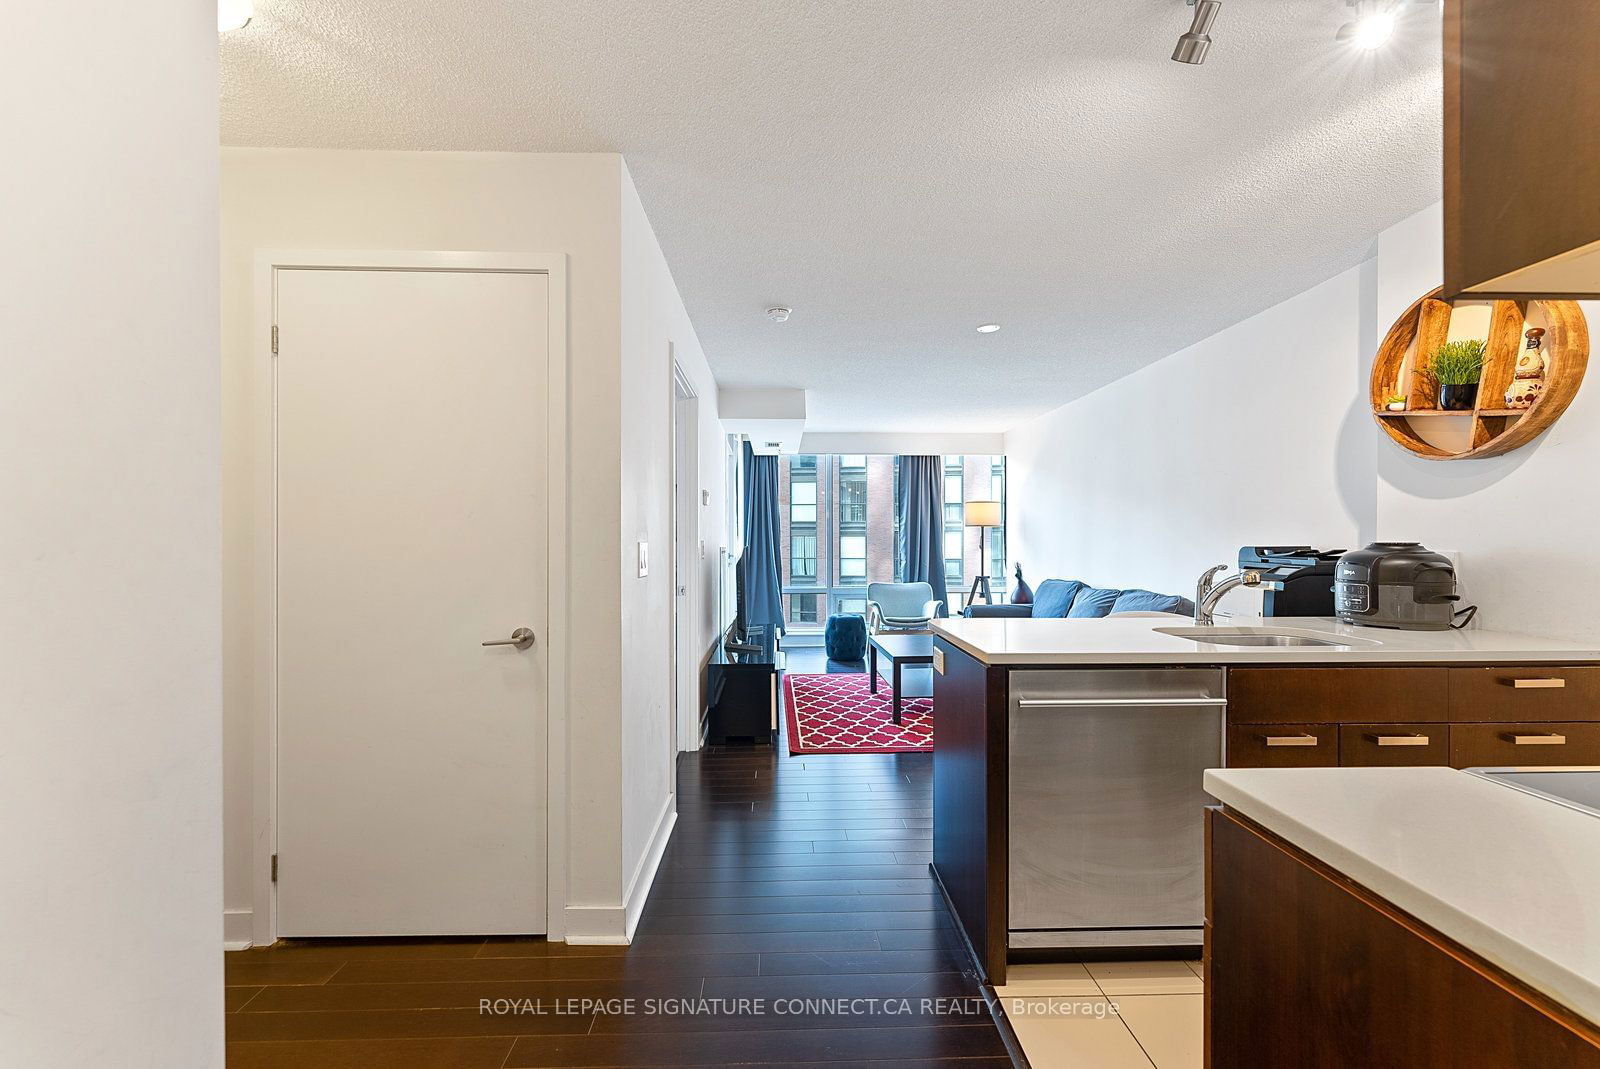
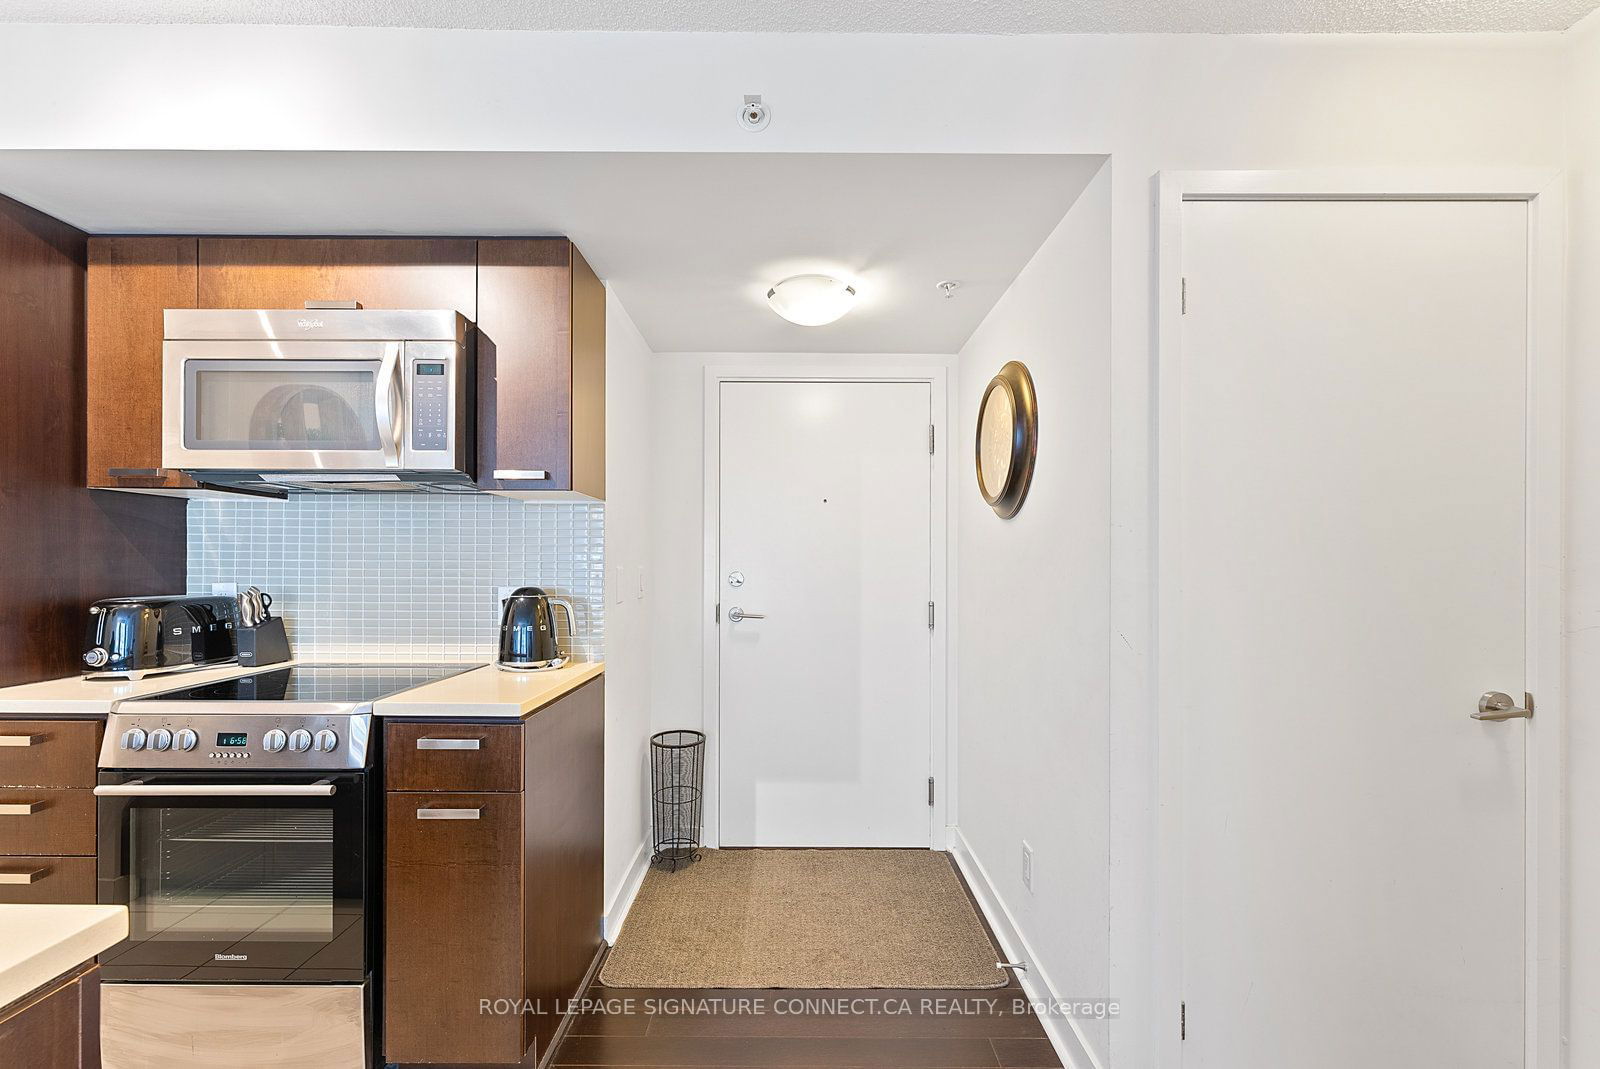
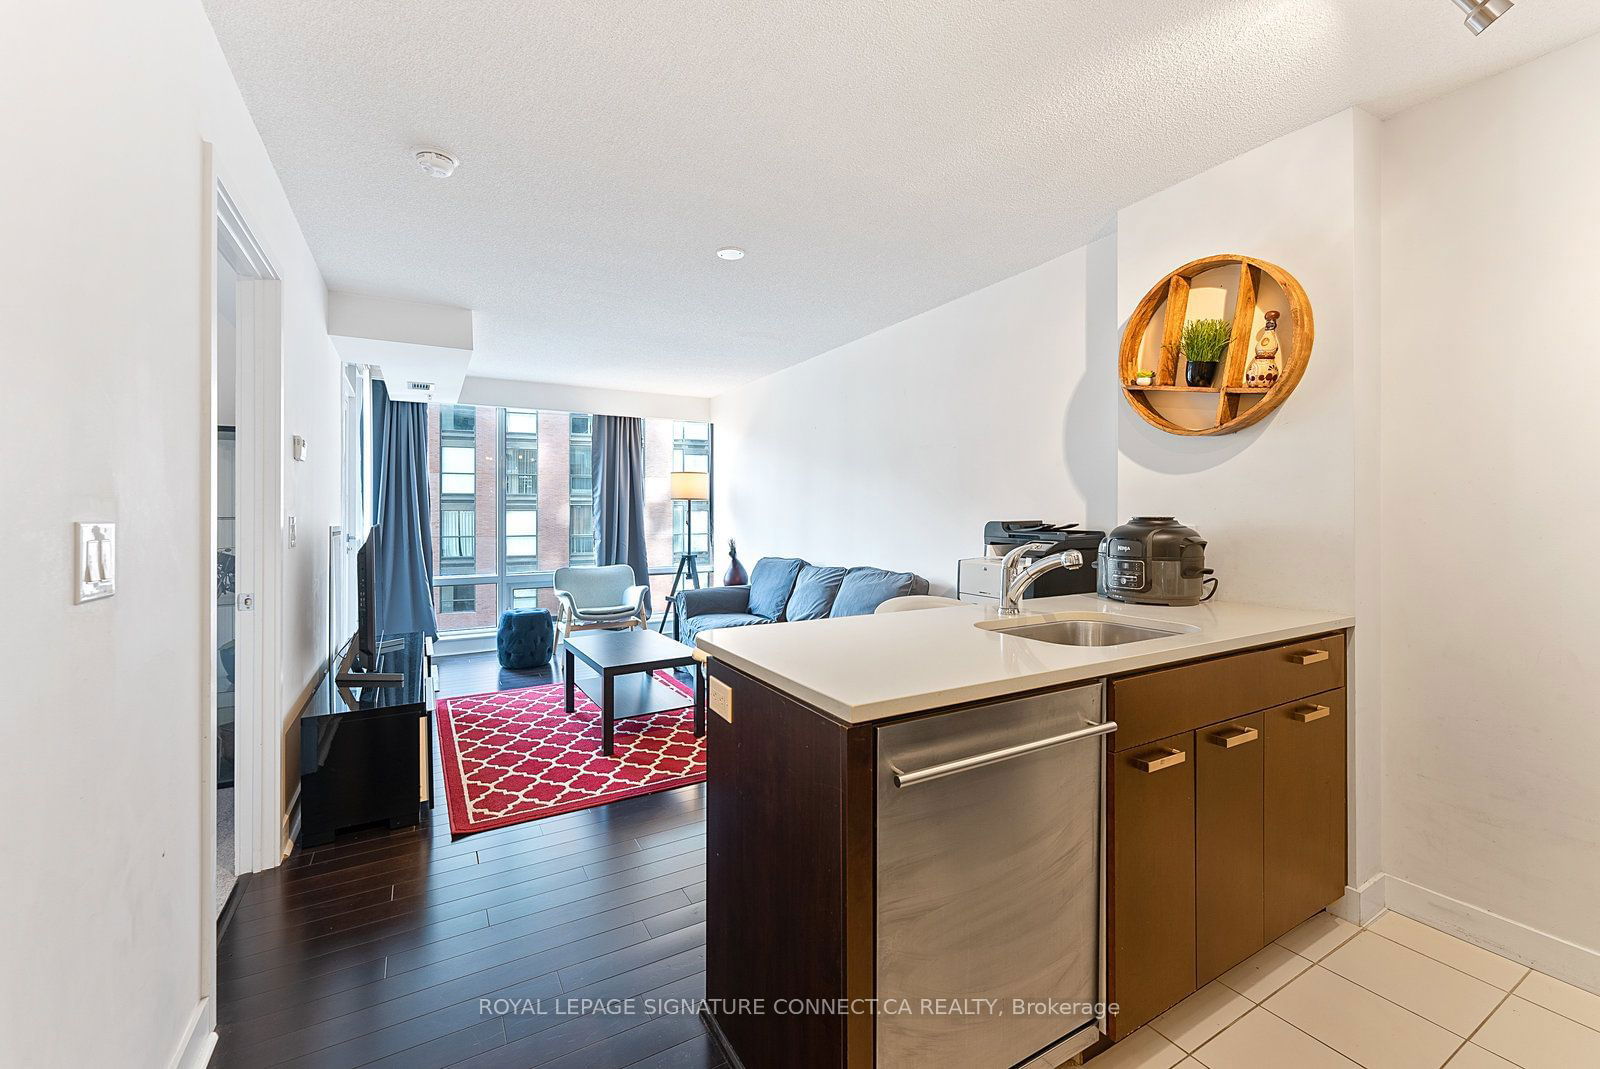
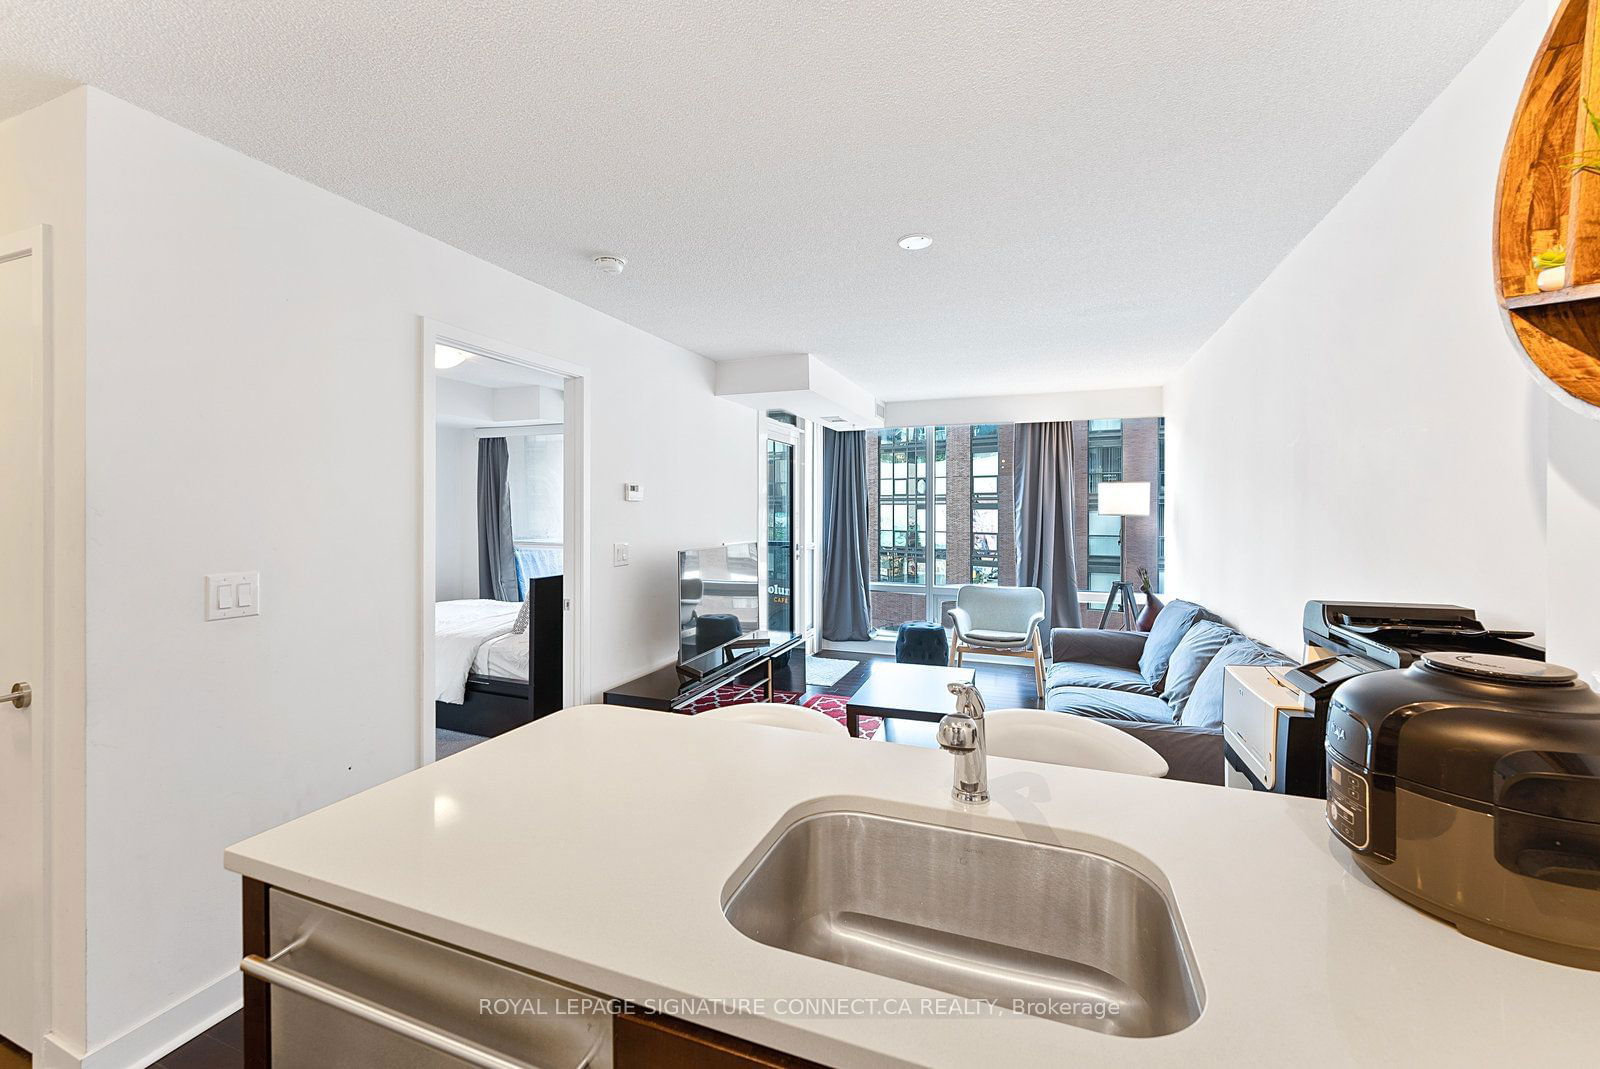
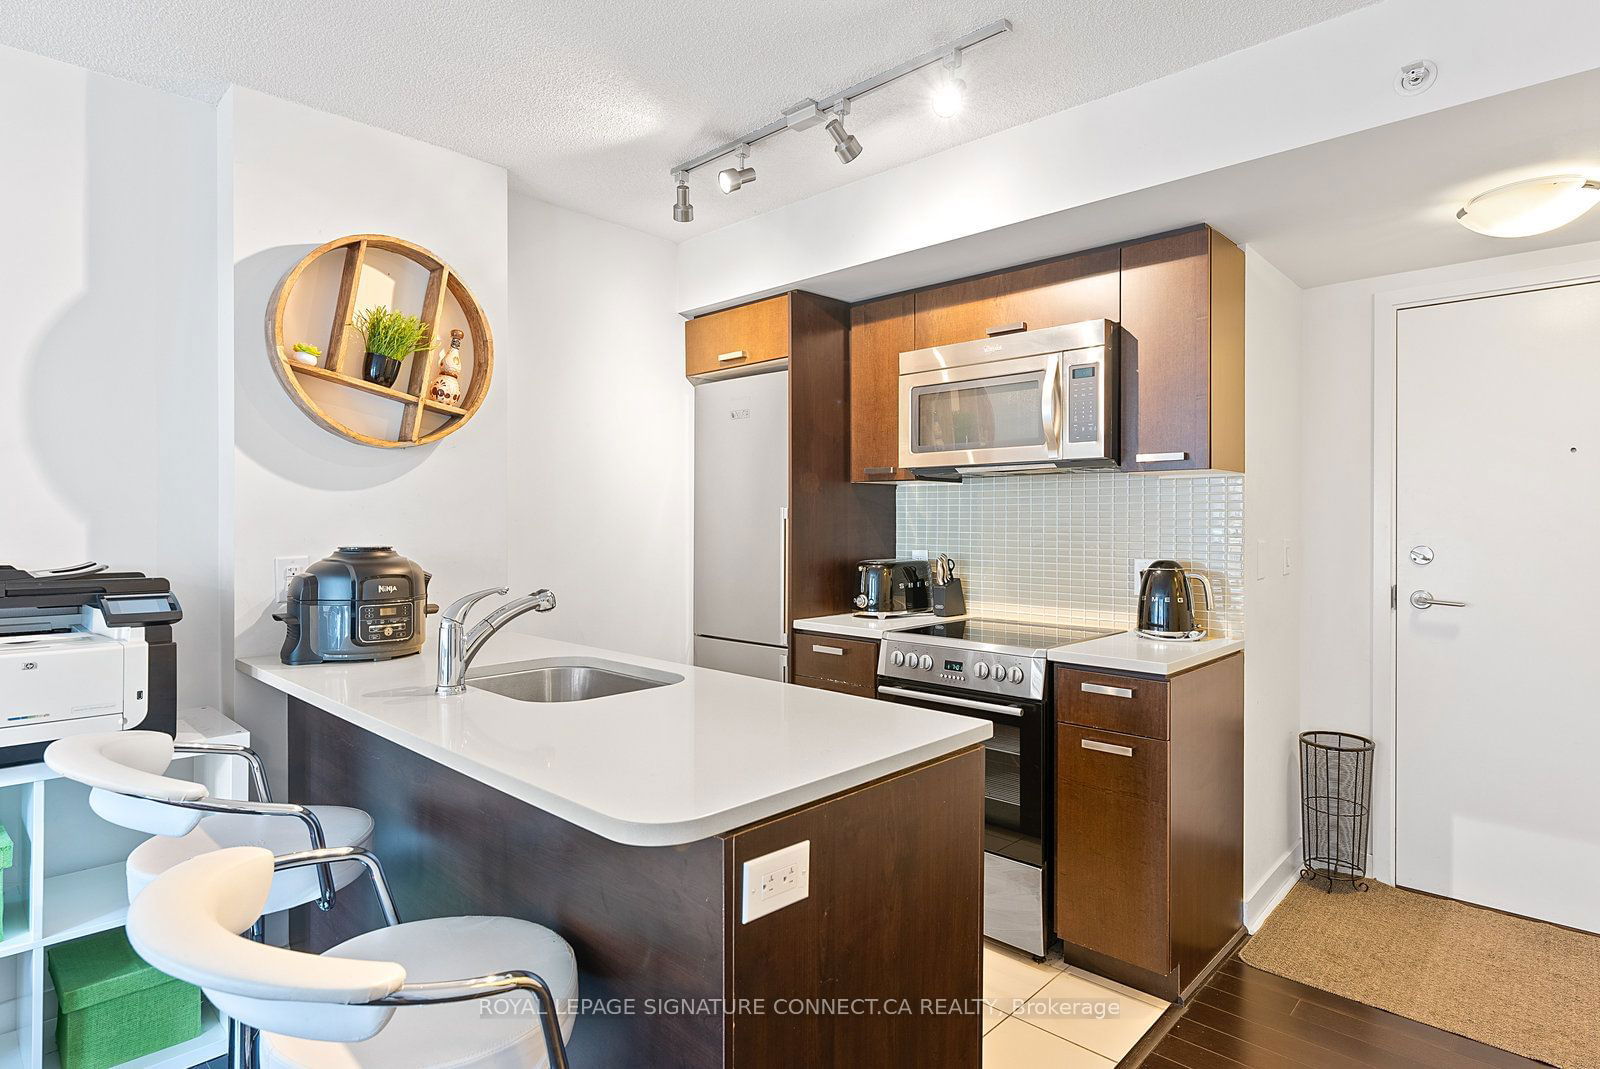
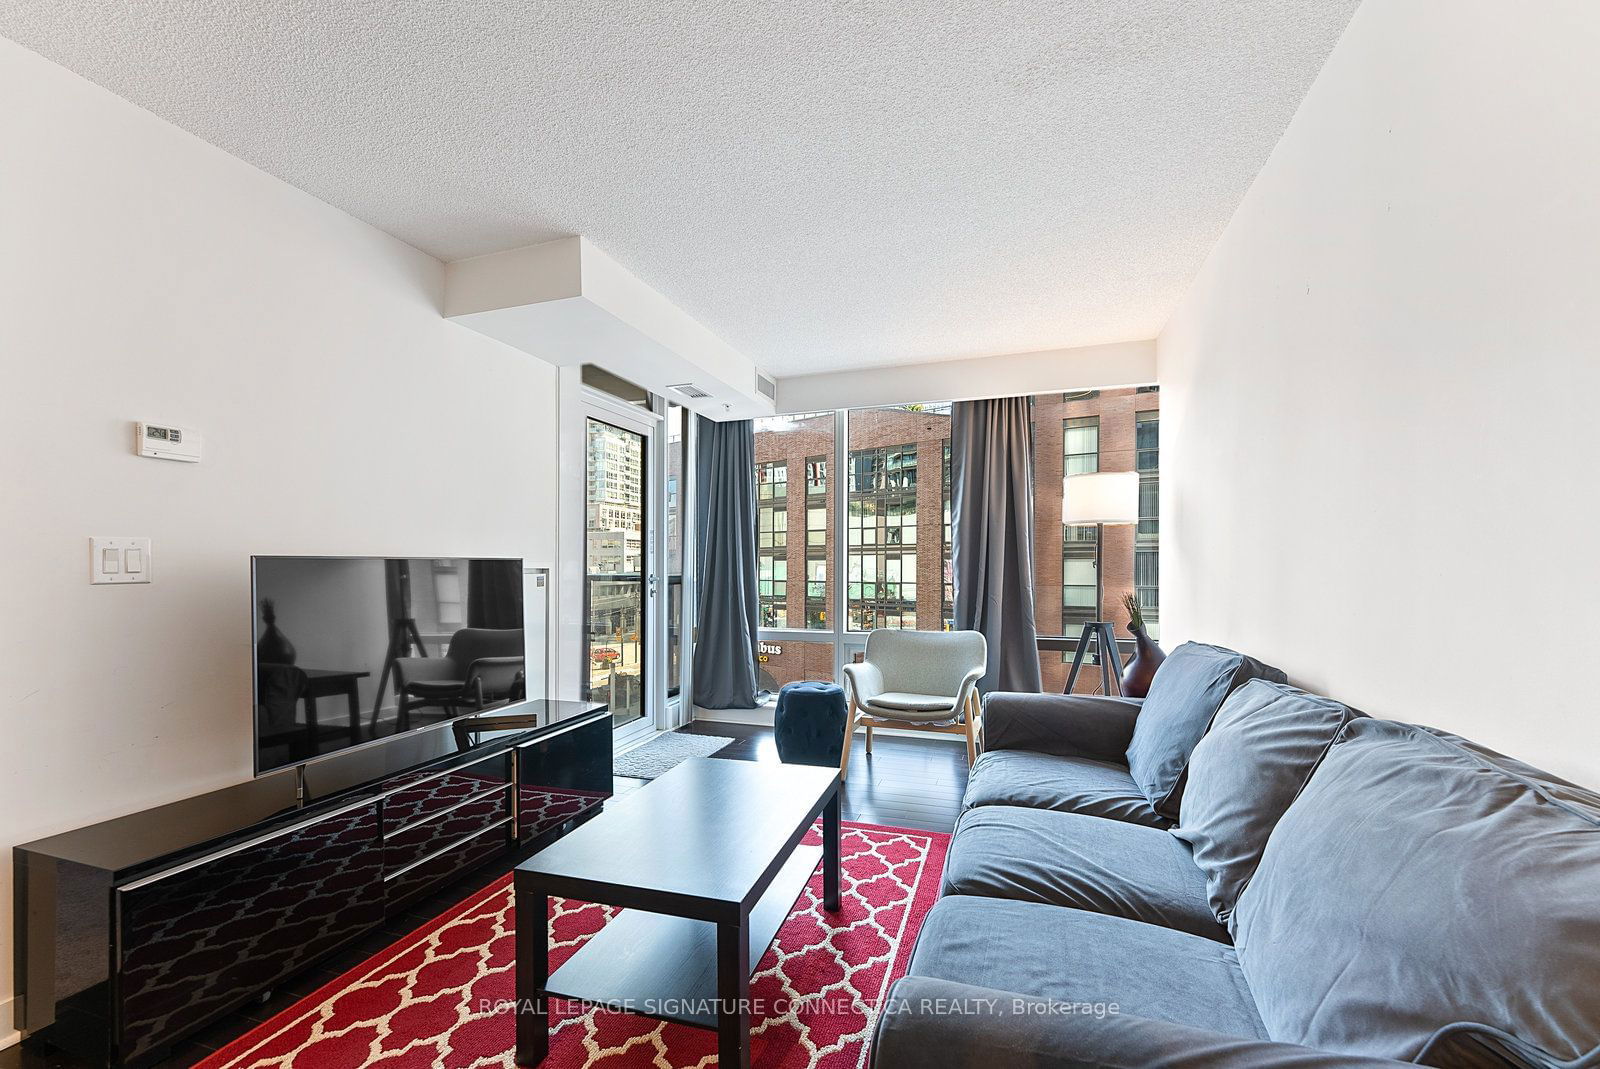
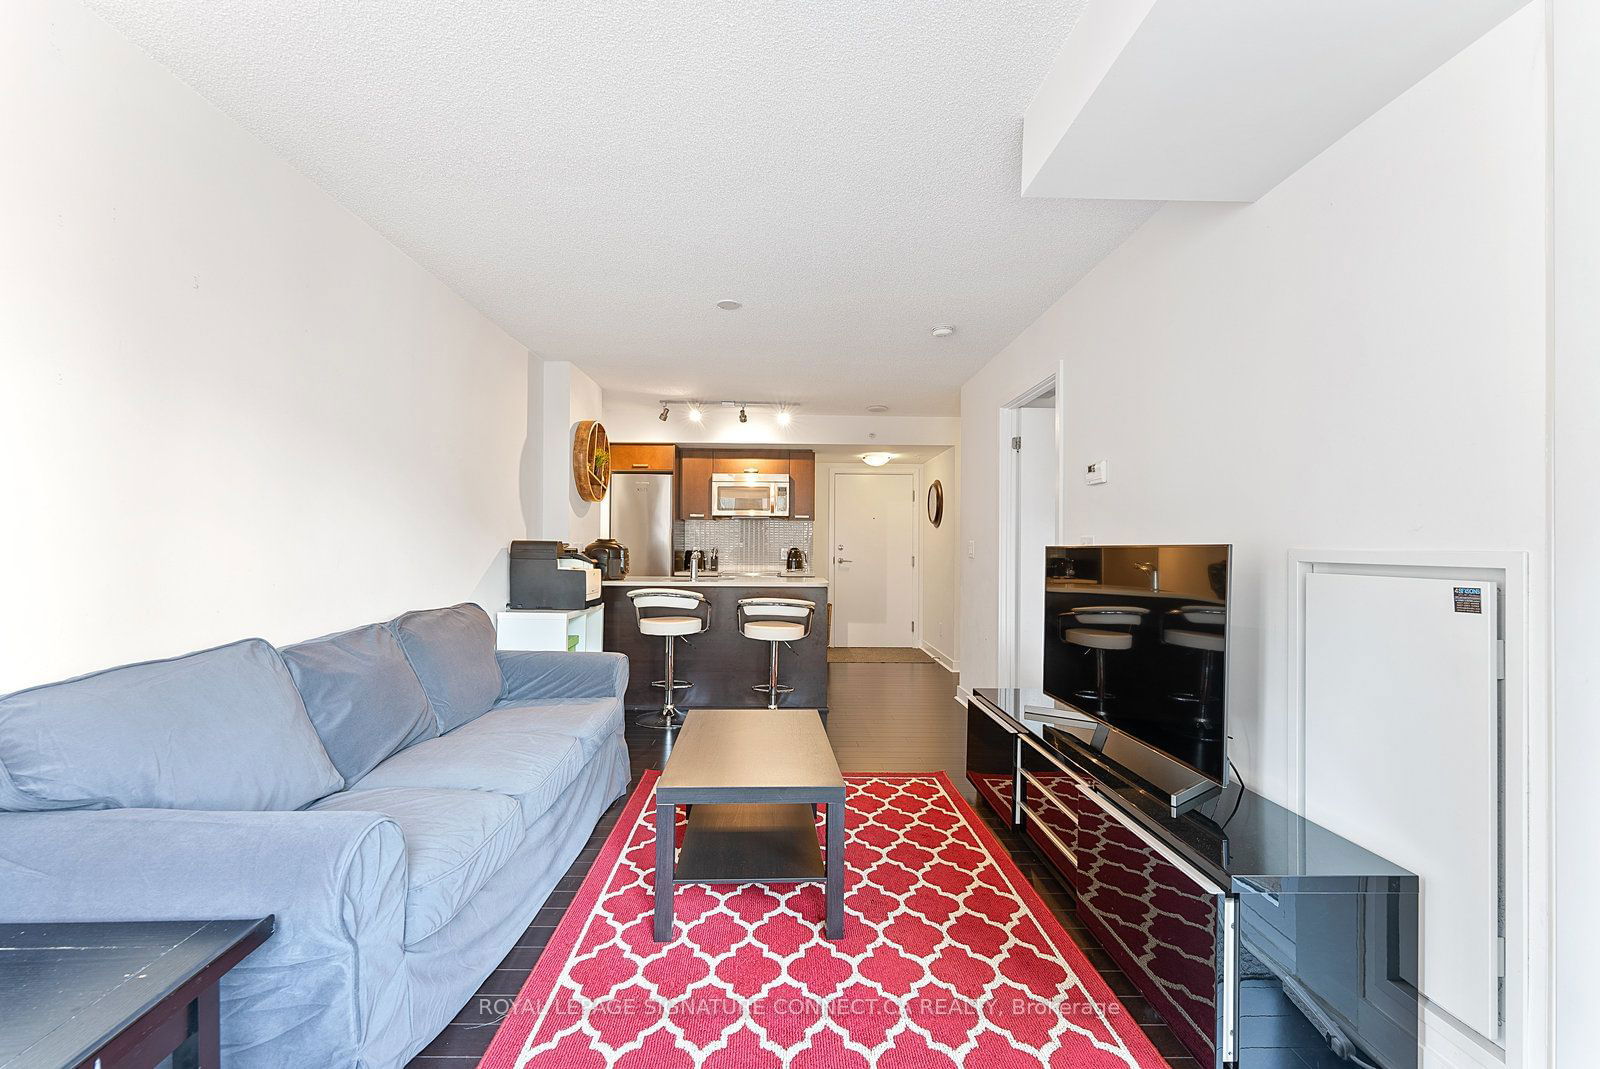
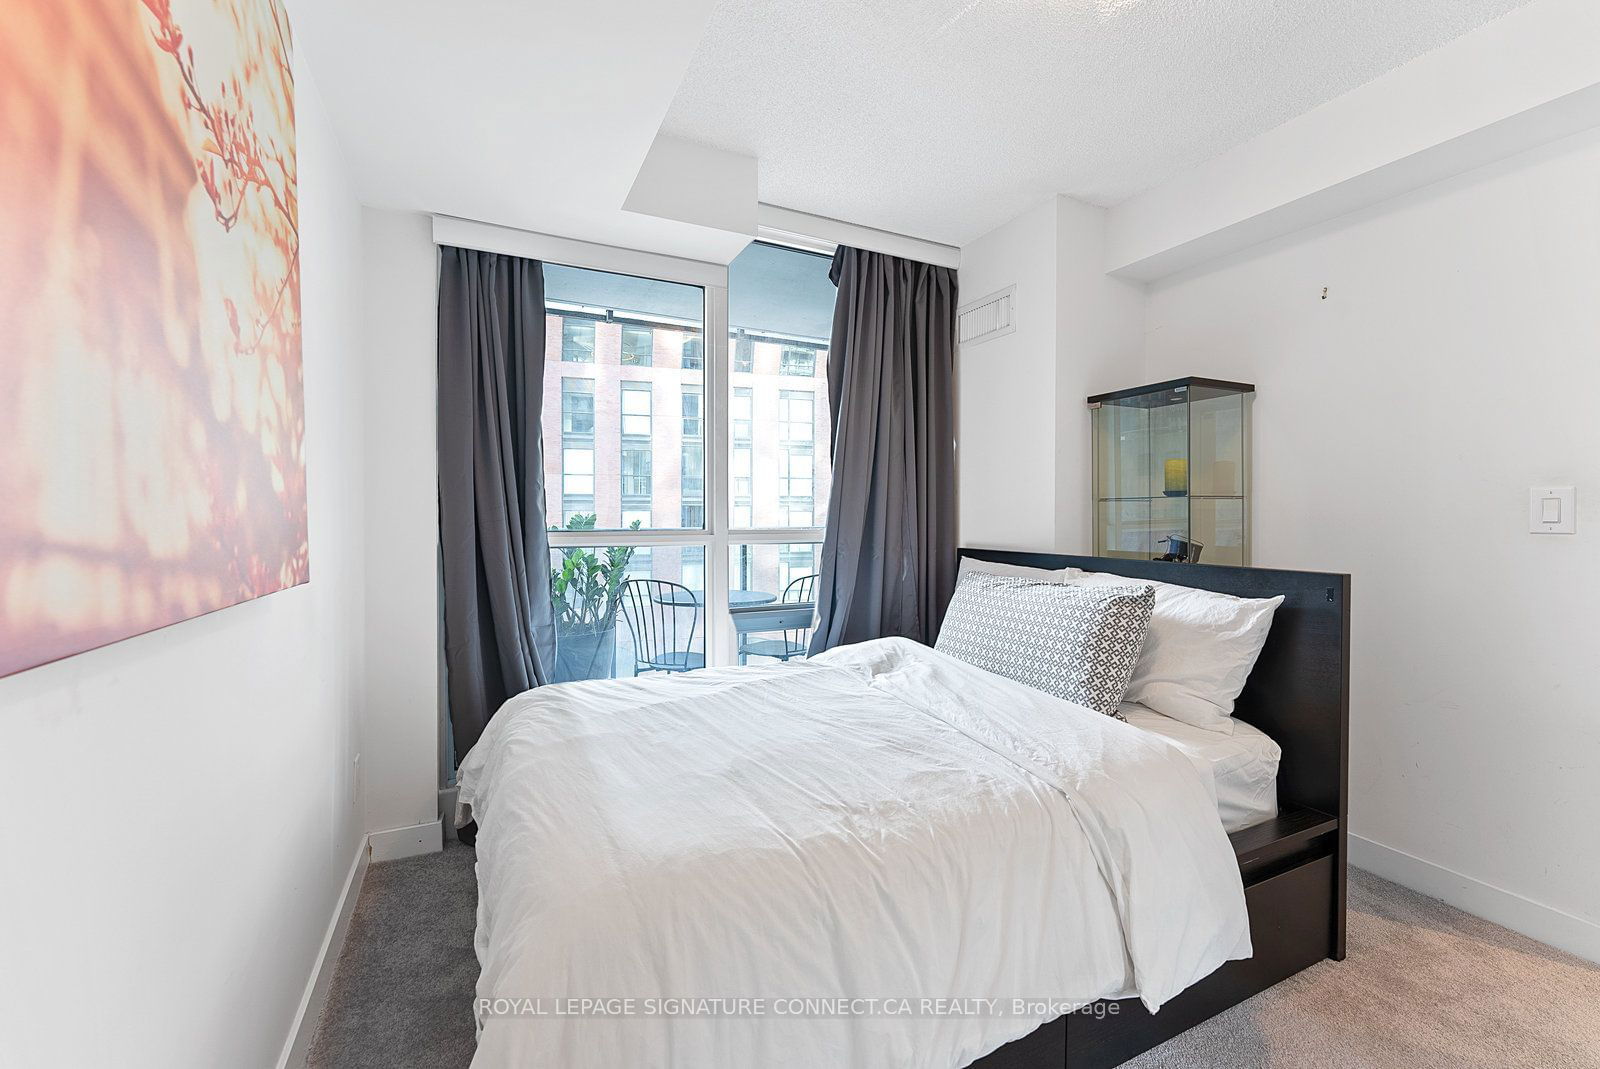
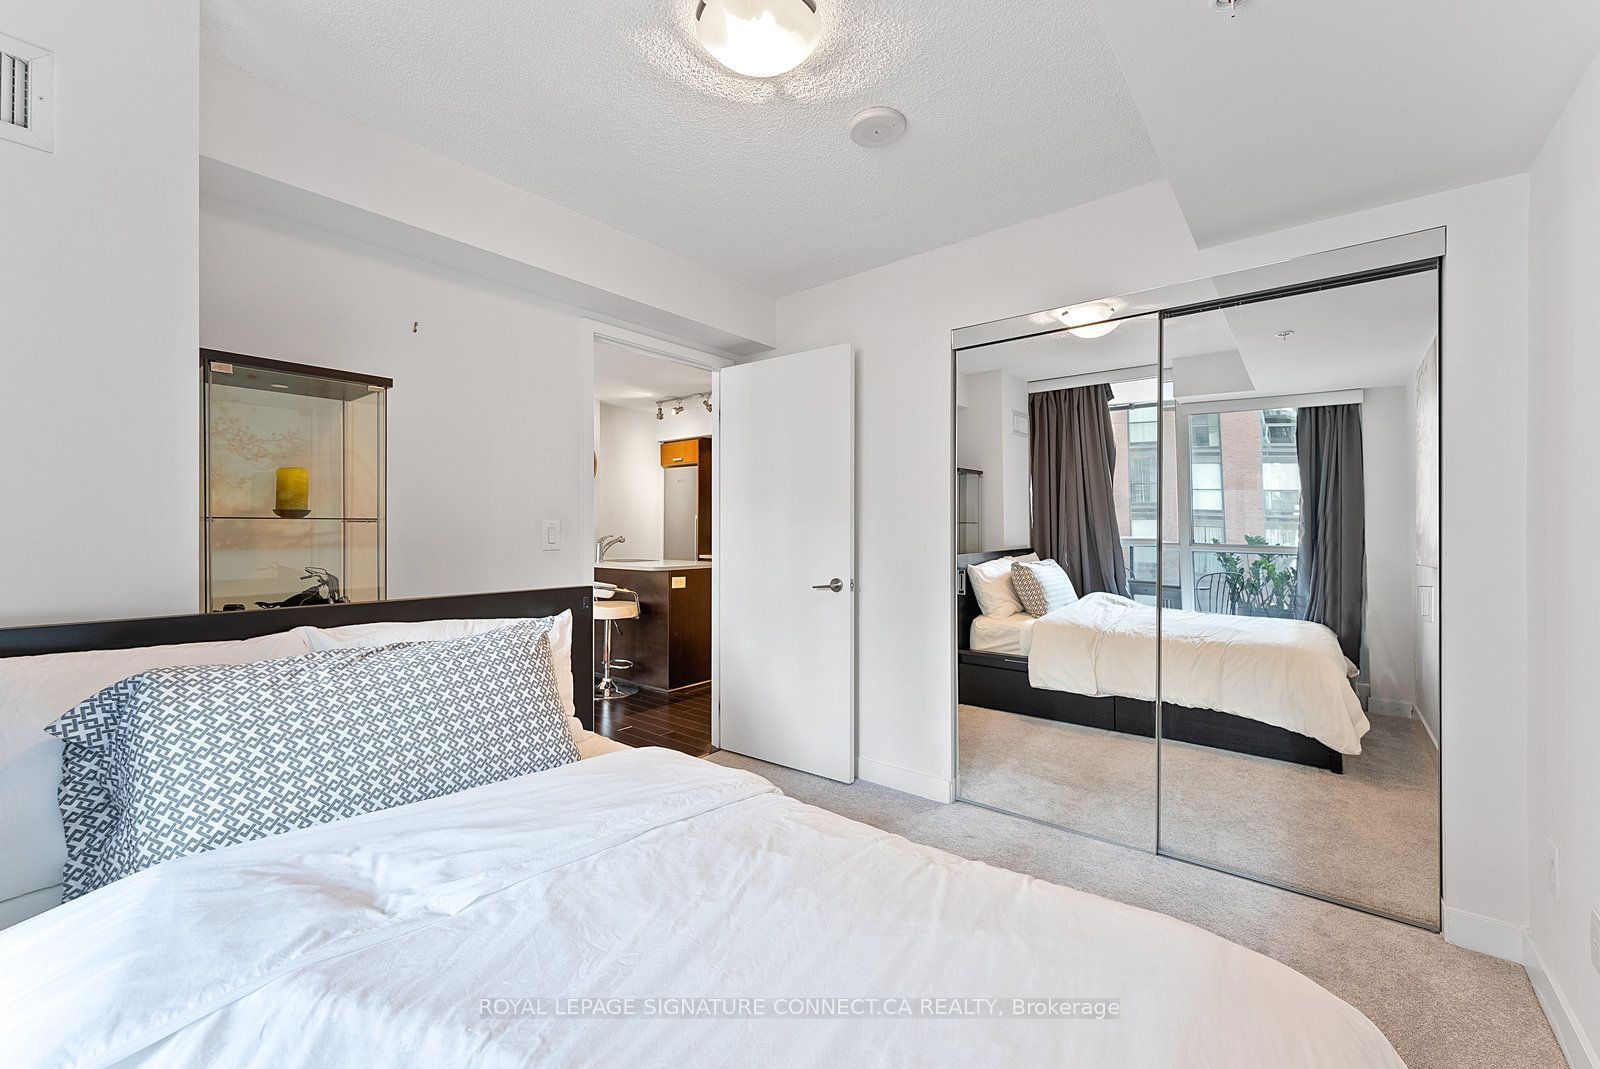
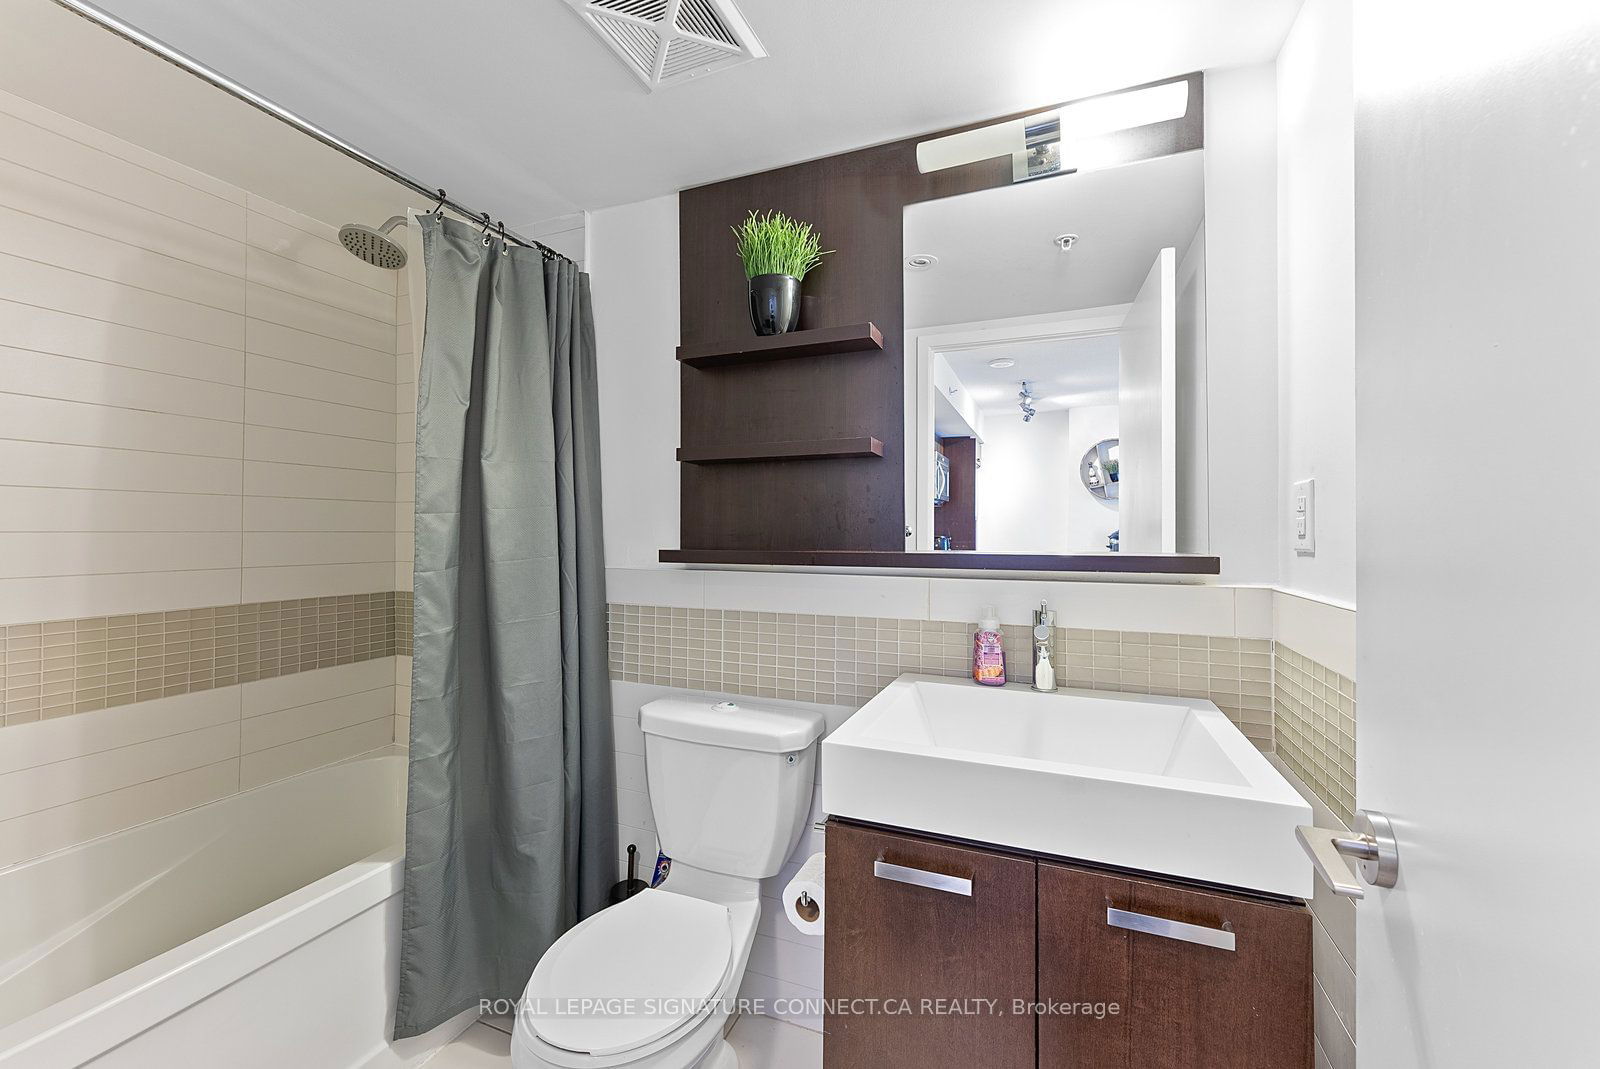
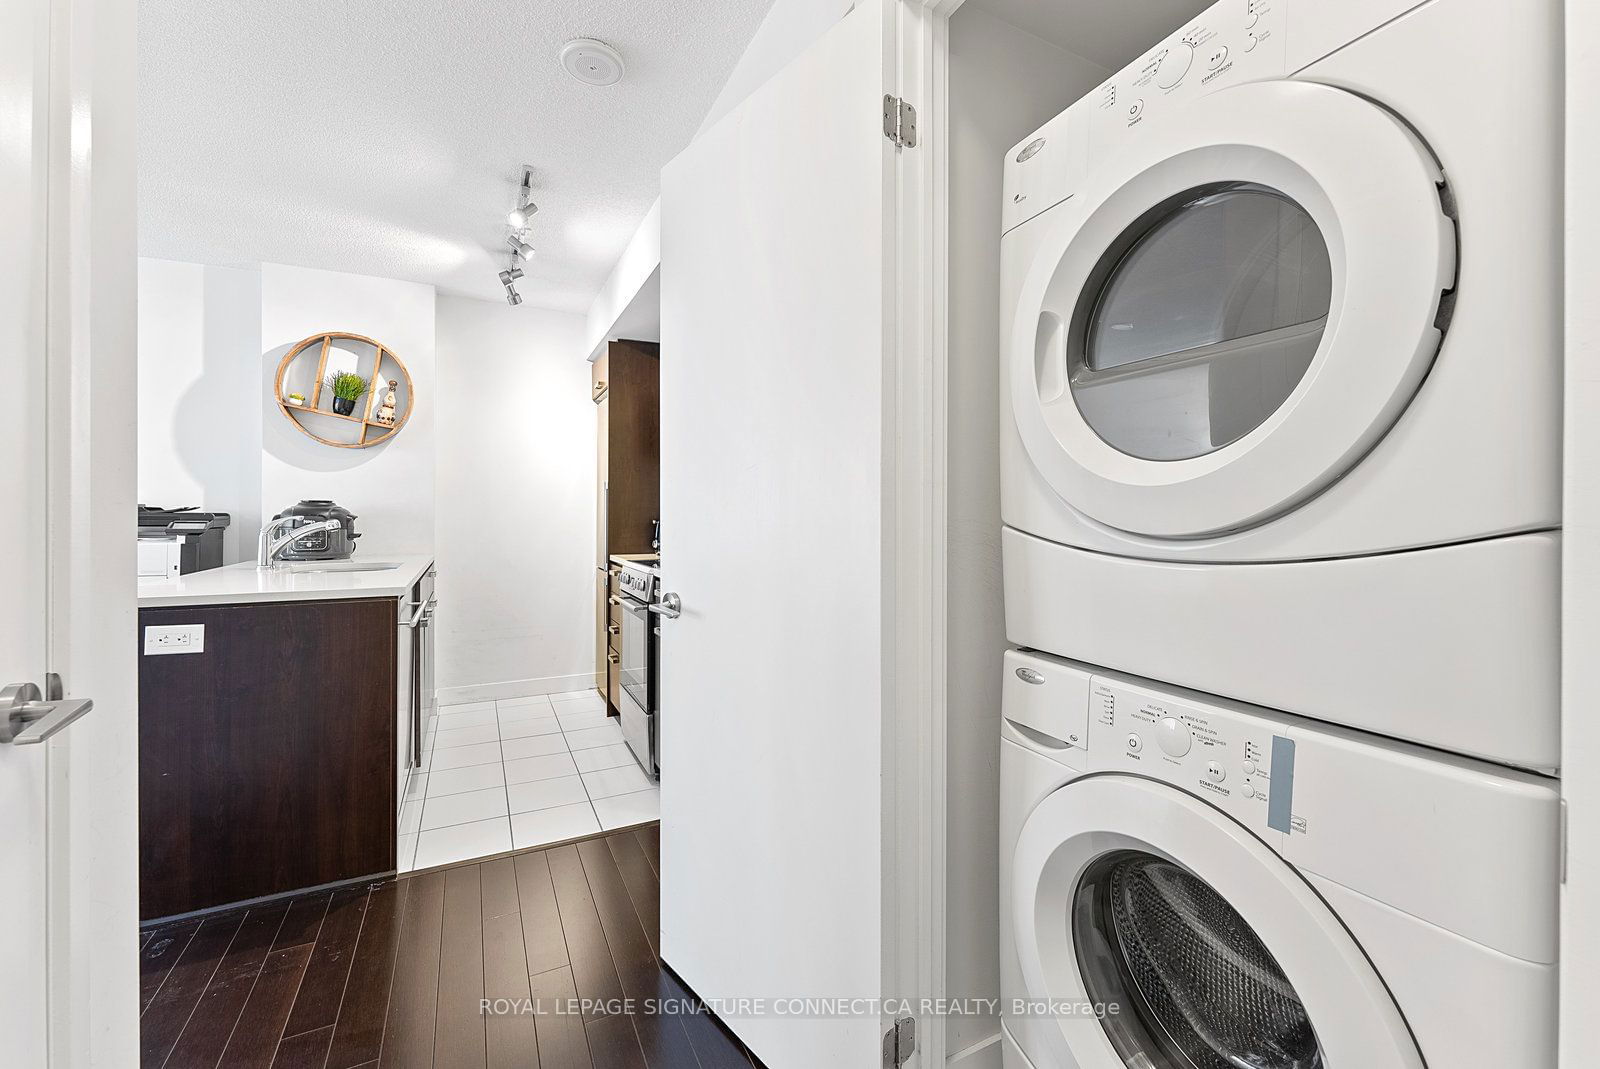
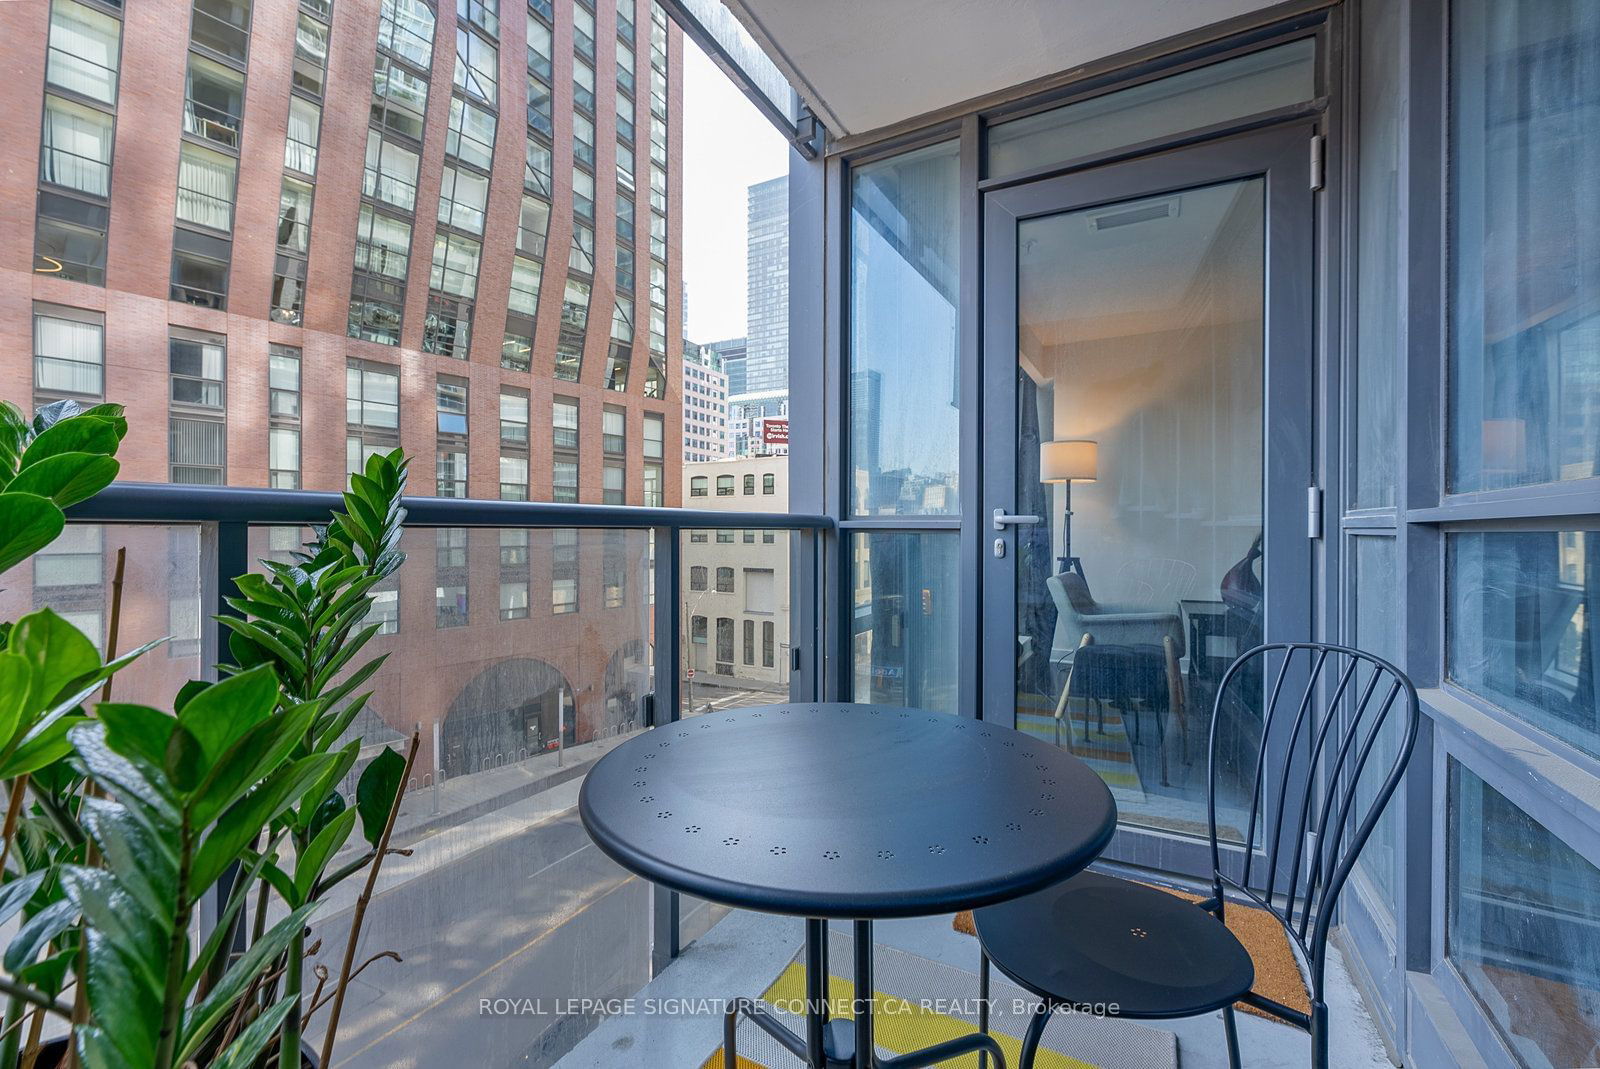
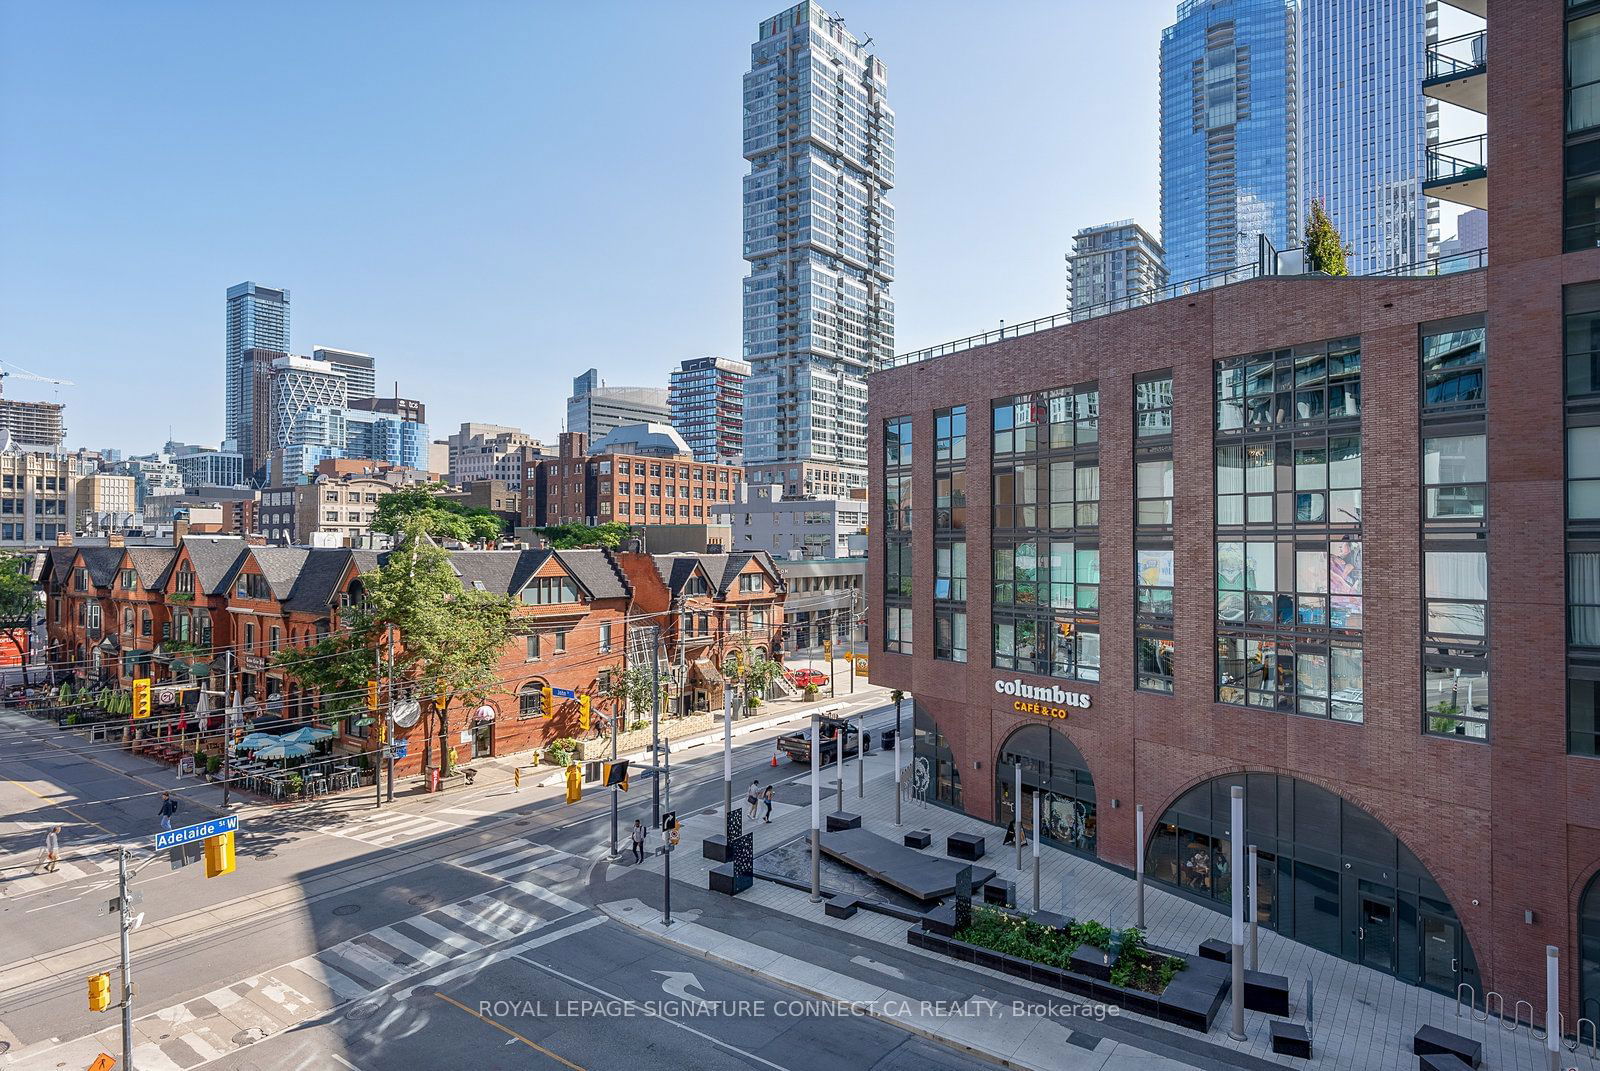
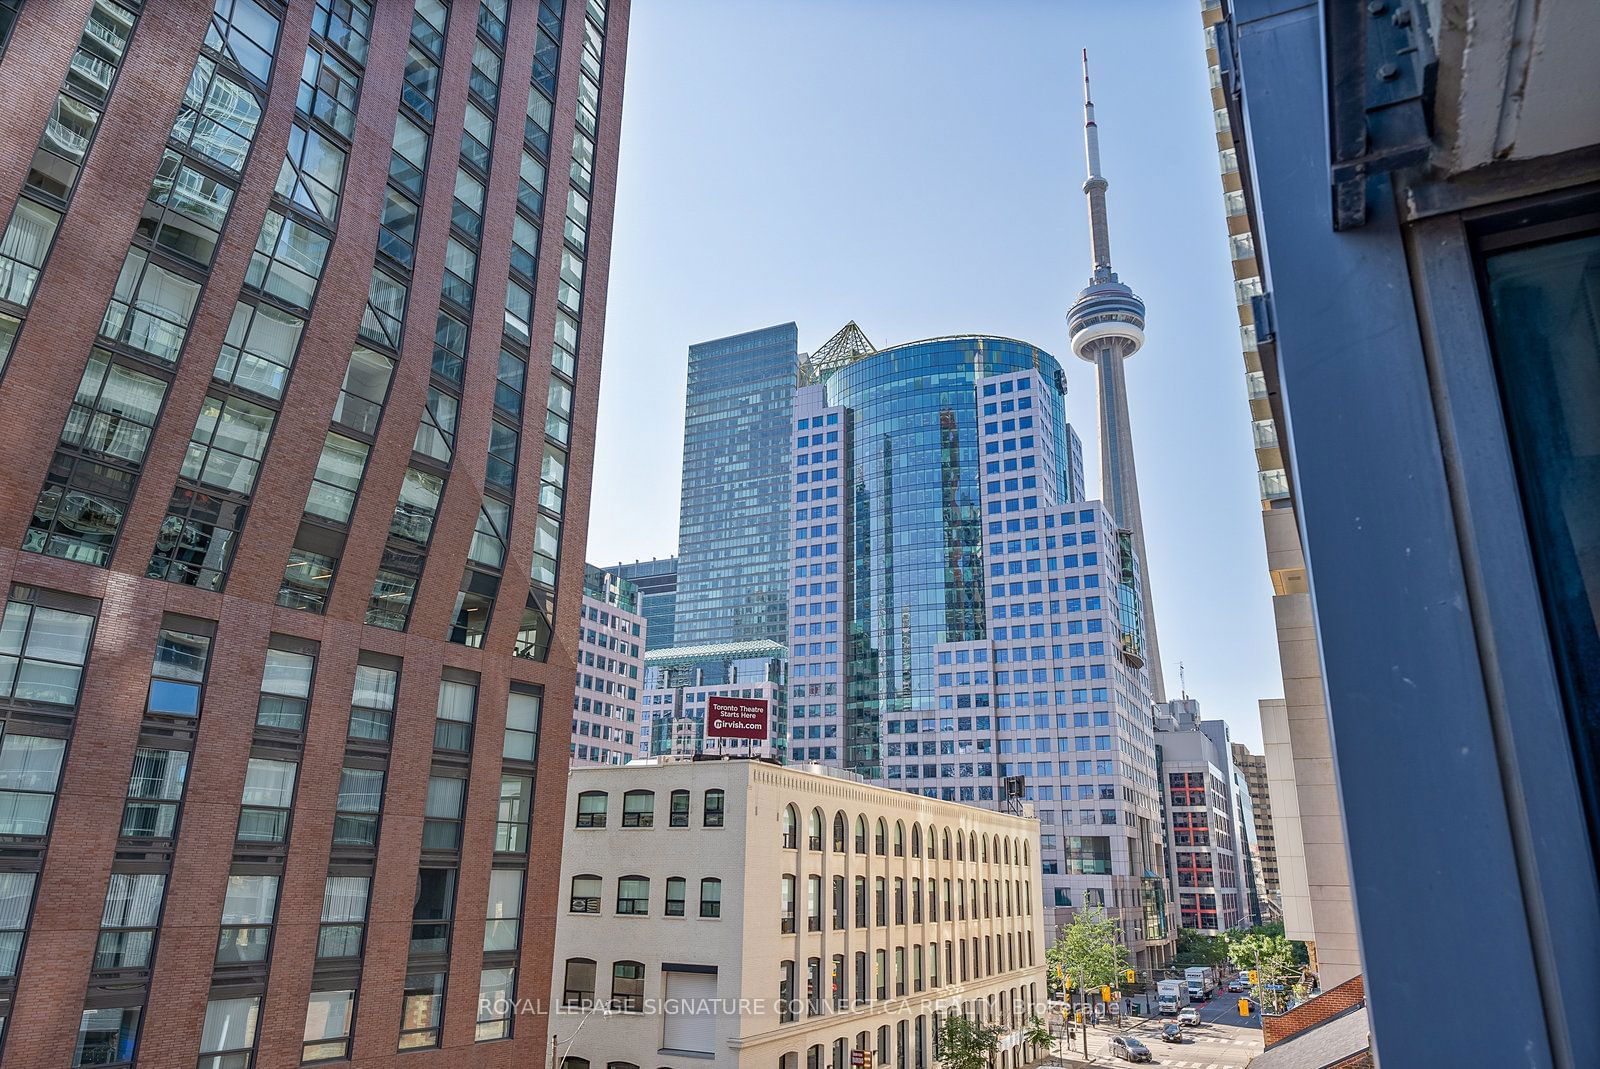
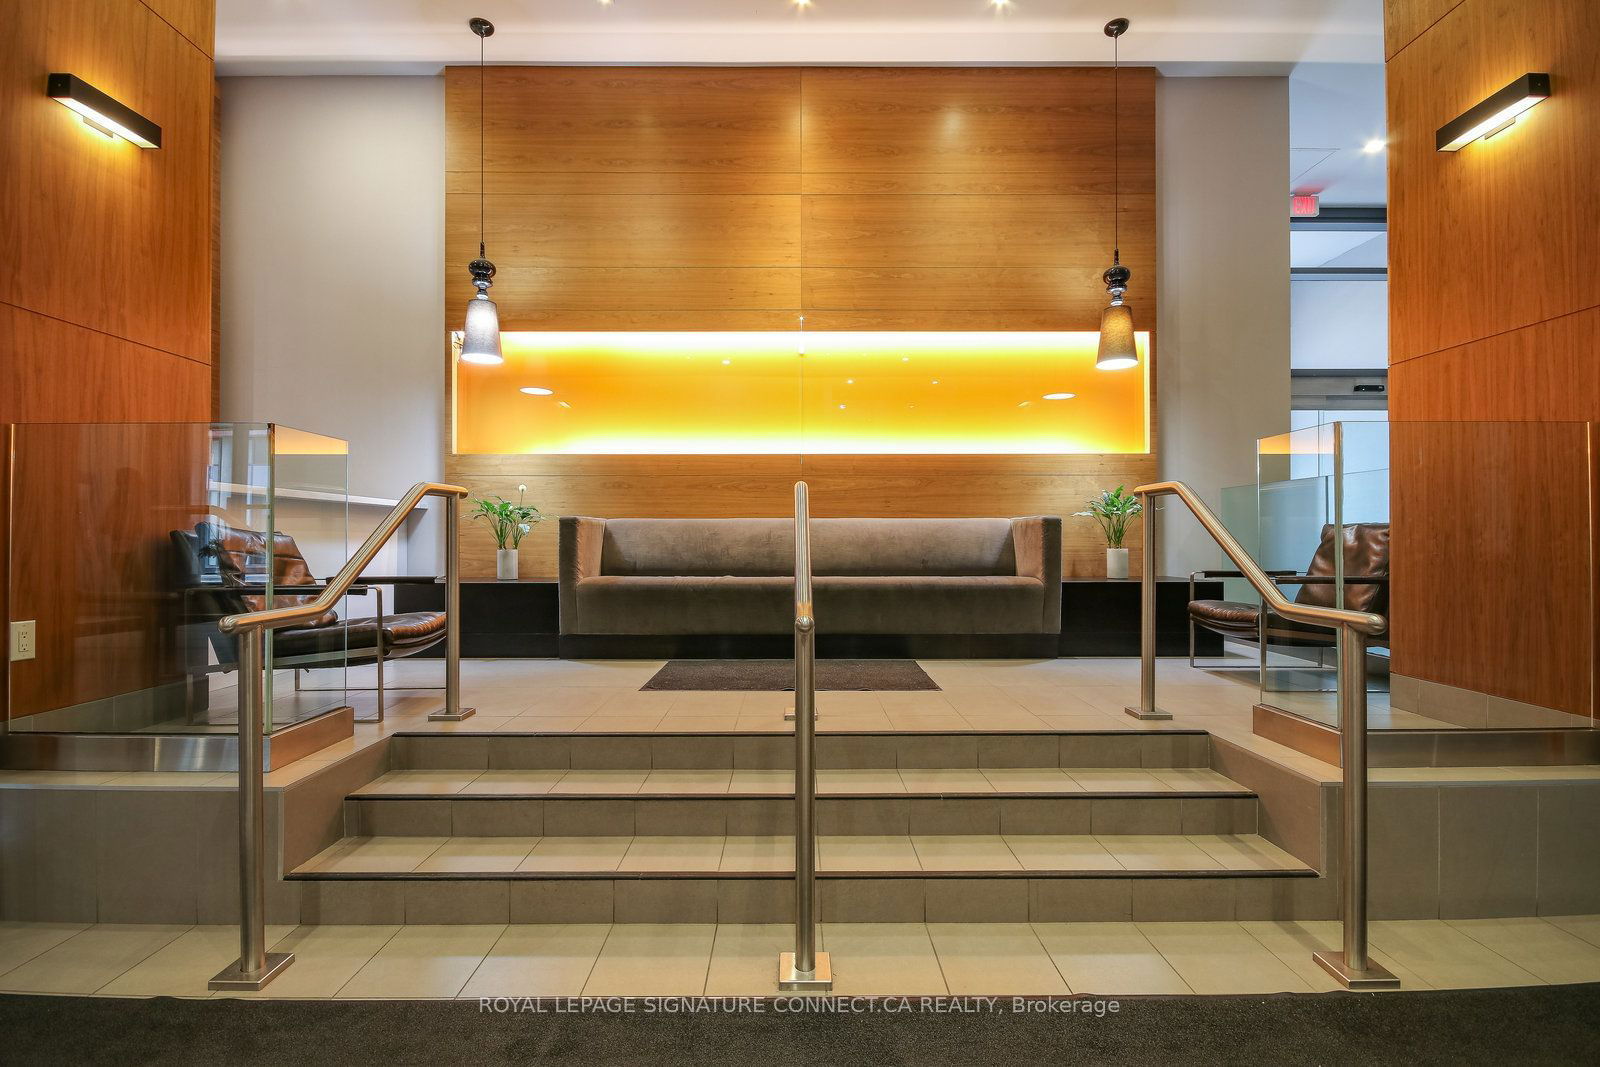
Experience effortless living in this fully furnished rental, complete with all-inclusive utilities, high-speed internet, a fully equipped kitchen, in-unit laundry, and fresh linens for added convenience. Located just steps from TIFF, the CN Tower, PATH, theaters, the Financial District, and the waterfront, with TTC access right outside your door. Enjoy premium amenities, including 24-hour concierge service, a fitness club with an indoor pool, a theater room, and a rooftop terrace. Available for both short-term (minimum 30 days) and Mid-term leases (maximum 9 Months), this rental offers all the essentials for a seamless and comfortable stay.
ExtrasParking available for $150.00 per Month
royal lepage signature connect.ca realtyMLS® #C9769245
Amenities
Explore Neighbourhood
Similar Listings
Demographics
Based on the dissemination area as defined by Statistics Canada. A dissemination area contains, on average, approximately 200 – 400 households.
Price Trends
Maintenance Fees
Building Trends At The Pinnacle on Adelaide
Days on Strata
List vs Selling Price
Offer Competition
Turnover of Units
Property Value
Price Ranking
Sold Units
Rented Units
Best Value Rank
Appreciation Rank
Rental Yield
High Demand
Transaction Insights at 295 Adelaide Street W
| Studio | 1 Bed | 1 Bed + Den | 2 Bed | 2 Bed + Den | 3 Bed | 3 Bed + Den | |
|---|---|---|---|---|---|---|---|
| Price Range | No Data | $644,000 - $691,000 | $691,786 | $668,500 - $1,065,000 | No Data | No Data | No Data |
| Avg. Cost Per Sqft | No Data | $1,076 | $1,047 | $972 | No Data | No Data | No Data |
| Price Range | No Data | $2,100 - $3,500 | $2,400 - $3,000 | $2,850 - $4,300 | No Data | No Data | No Data |
| Avg. Wait for Unit Availability | No Data | 31 Days | 35 Days | 29 Days | 387 Days | No Data | 20 Days |
| Avg. Wait for Unit Availability | No Data | 8 Days | 13 Days | 12 Days | 367 Days | 390 Days | No Data |
| Ratio of Units in Building | 1% | 40% | 28% | 32% | 2% | 1% | 1% |
Transactions vs Inventory
Total number of units listed and leased in King West
